Every live title availability across supported retailer storefronts is listed in the Price Comparison dashboard. From here, users can compare price points across providers, retailers, territories, genres, and more.
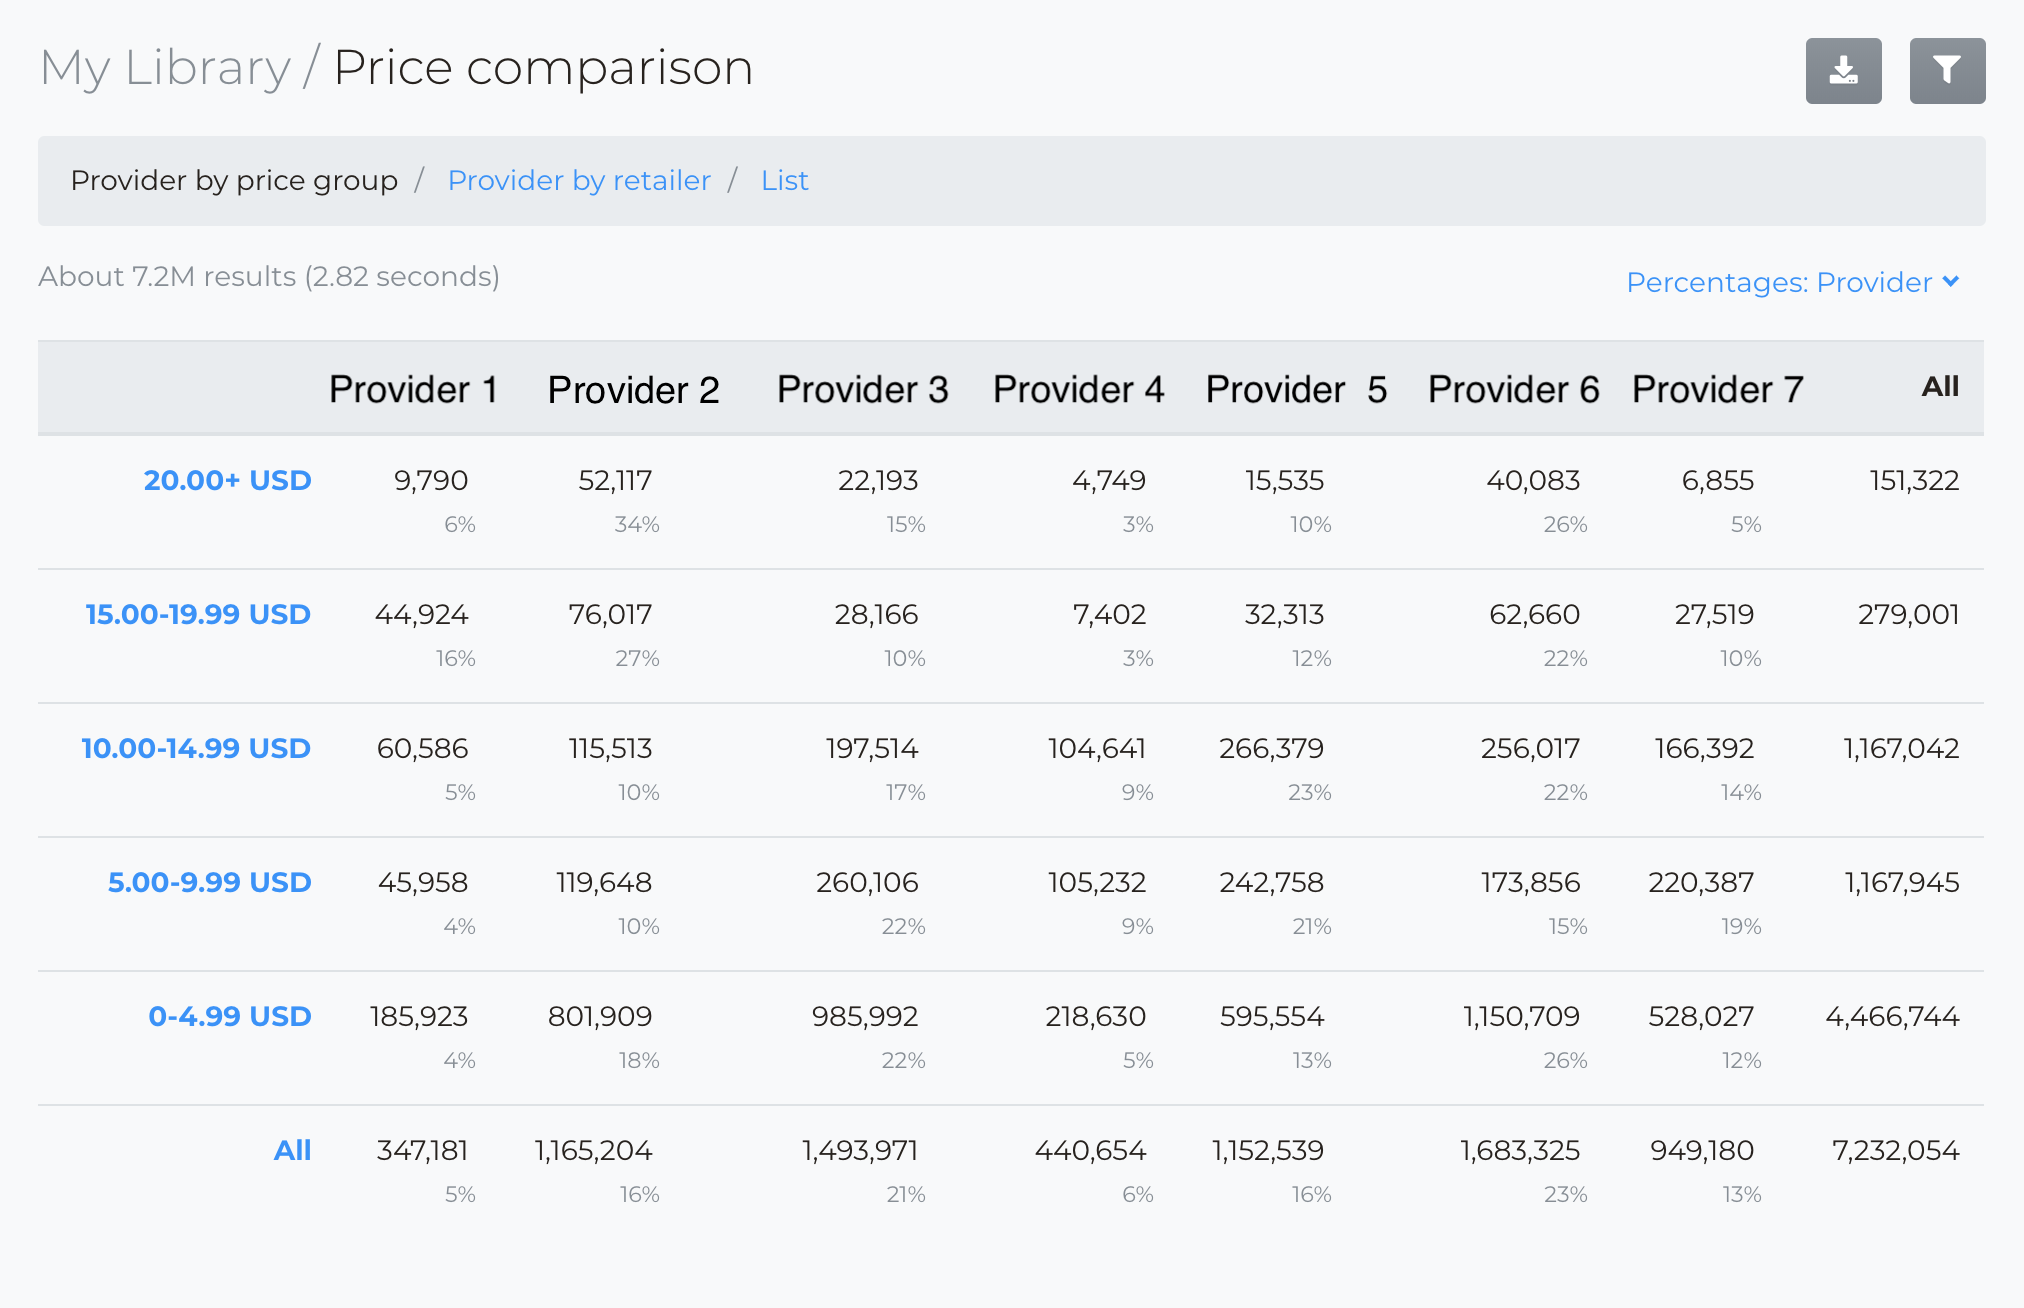
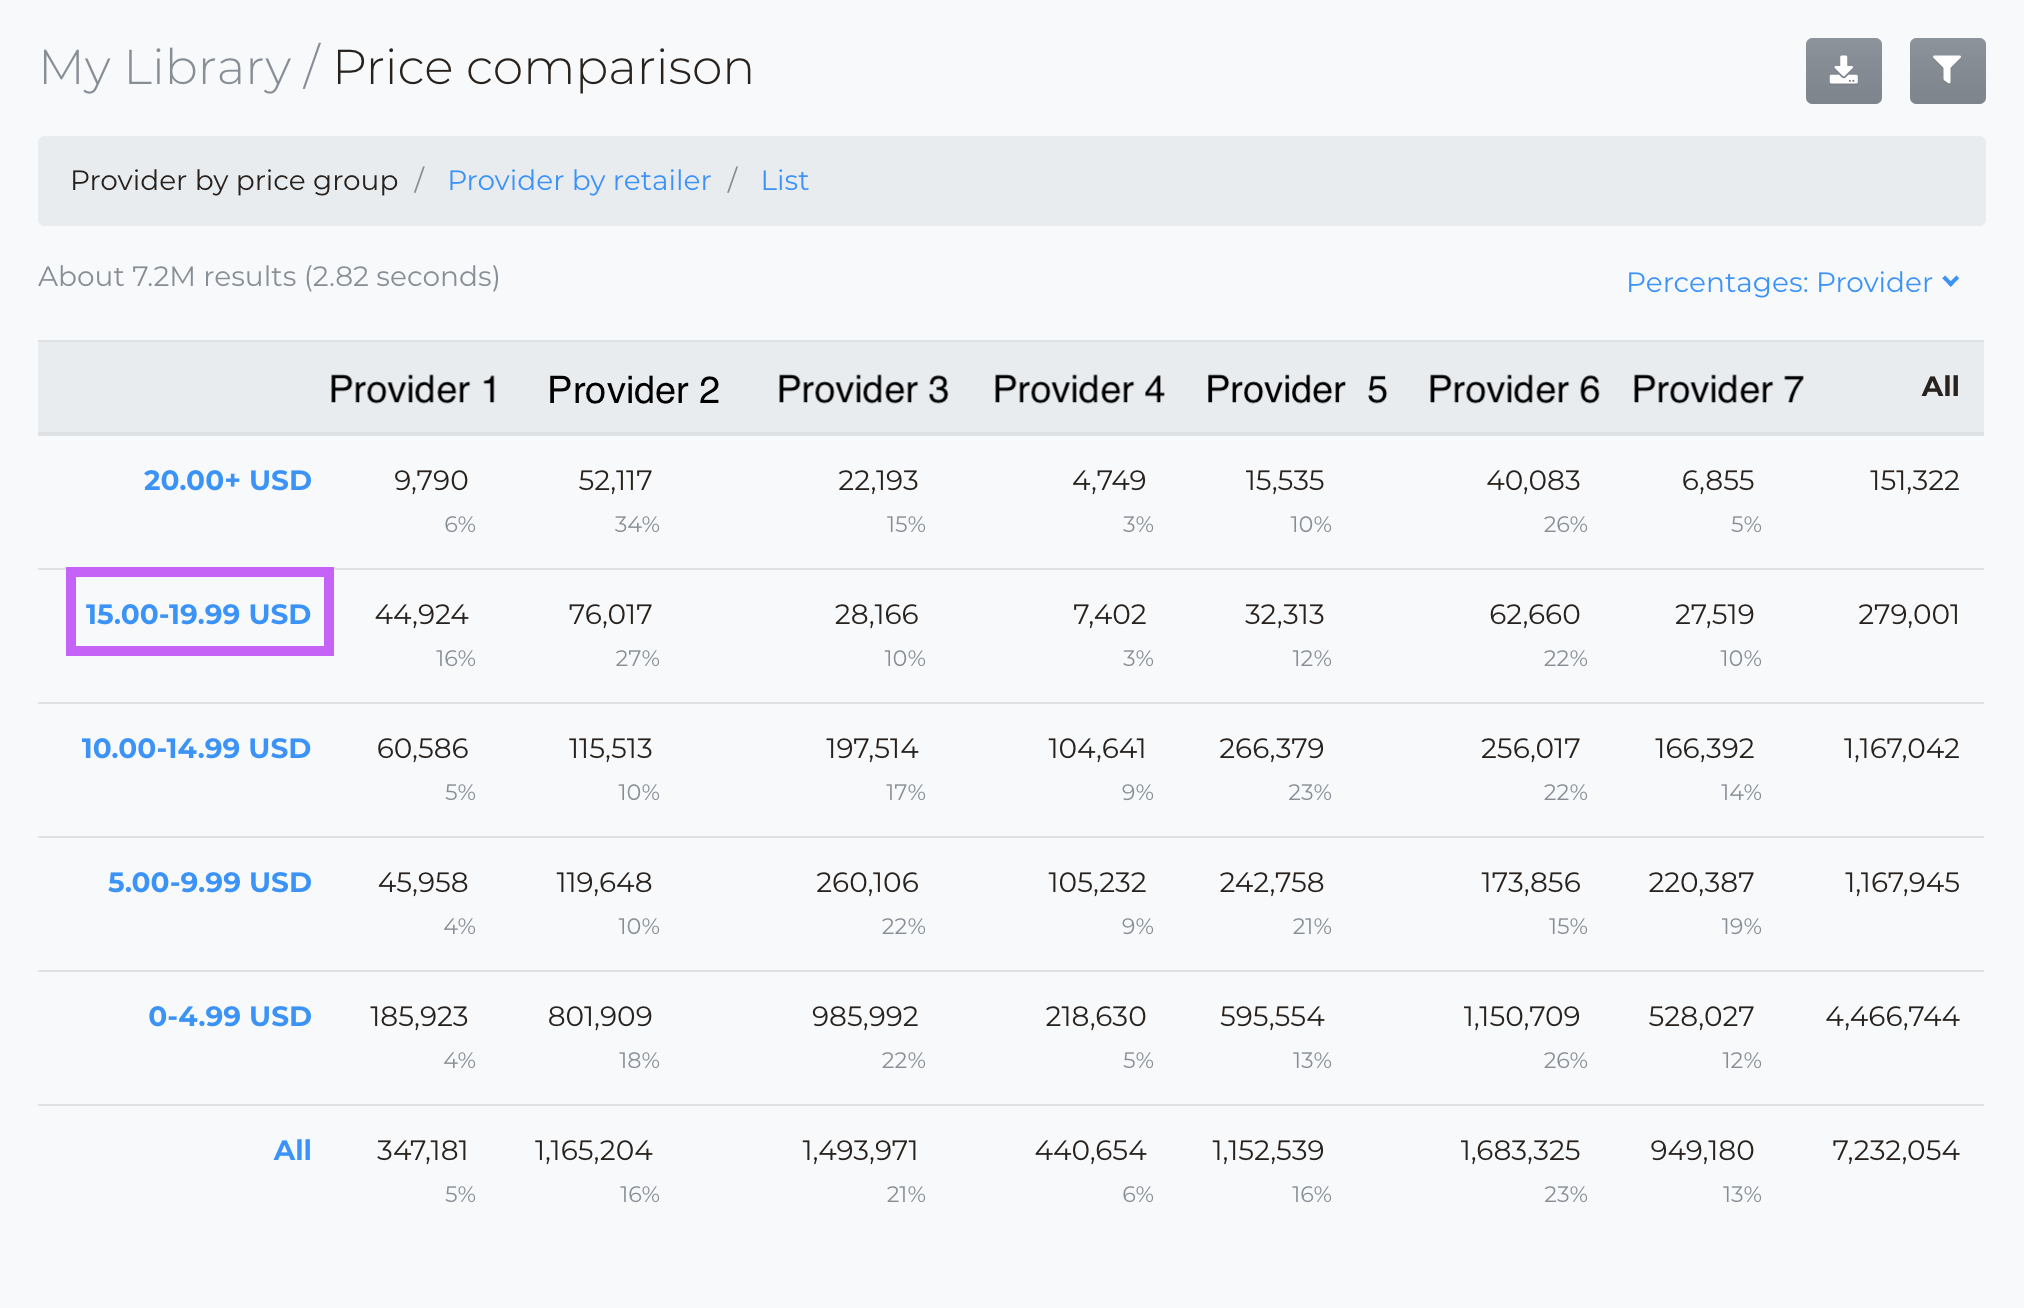
The numbers in each cell represent the total number of offers for a provider at this price point. Data can be arranged to view the percentage of a price range each provider's library takes up:
In the above screenshot, we see the total number of each provider's titles that are in the $20.00+ price range. Provider 1 takes up 6% of the of the titles in the $20.00+ price range. Provider 2 titles take up 34% in this range.
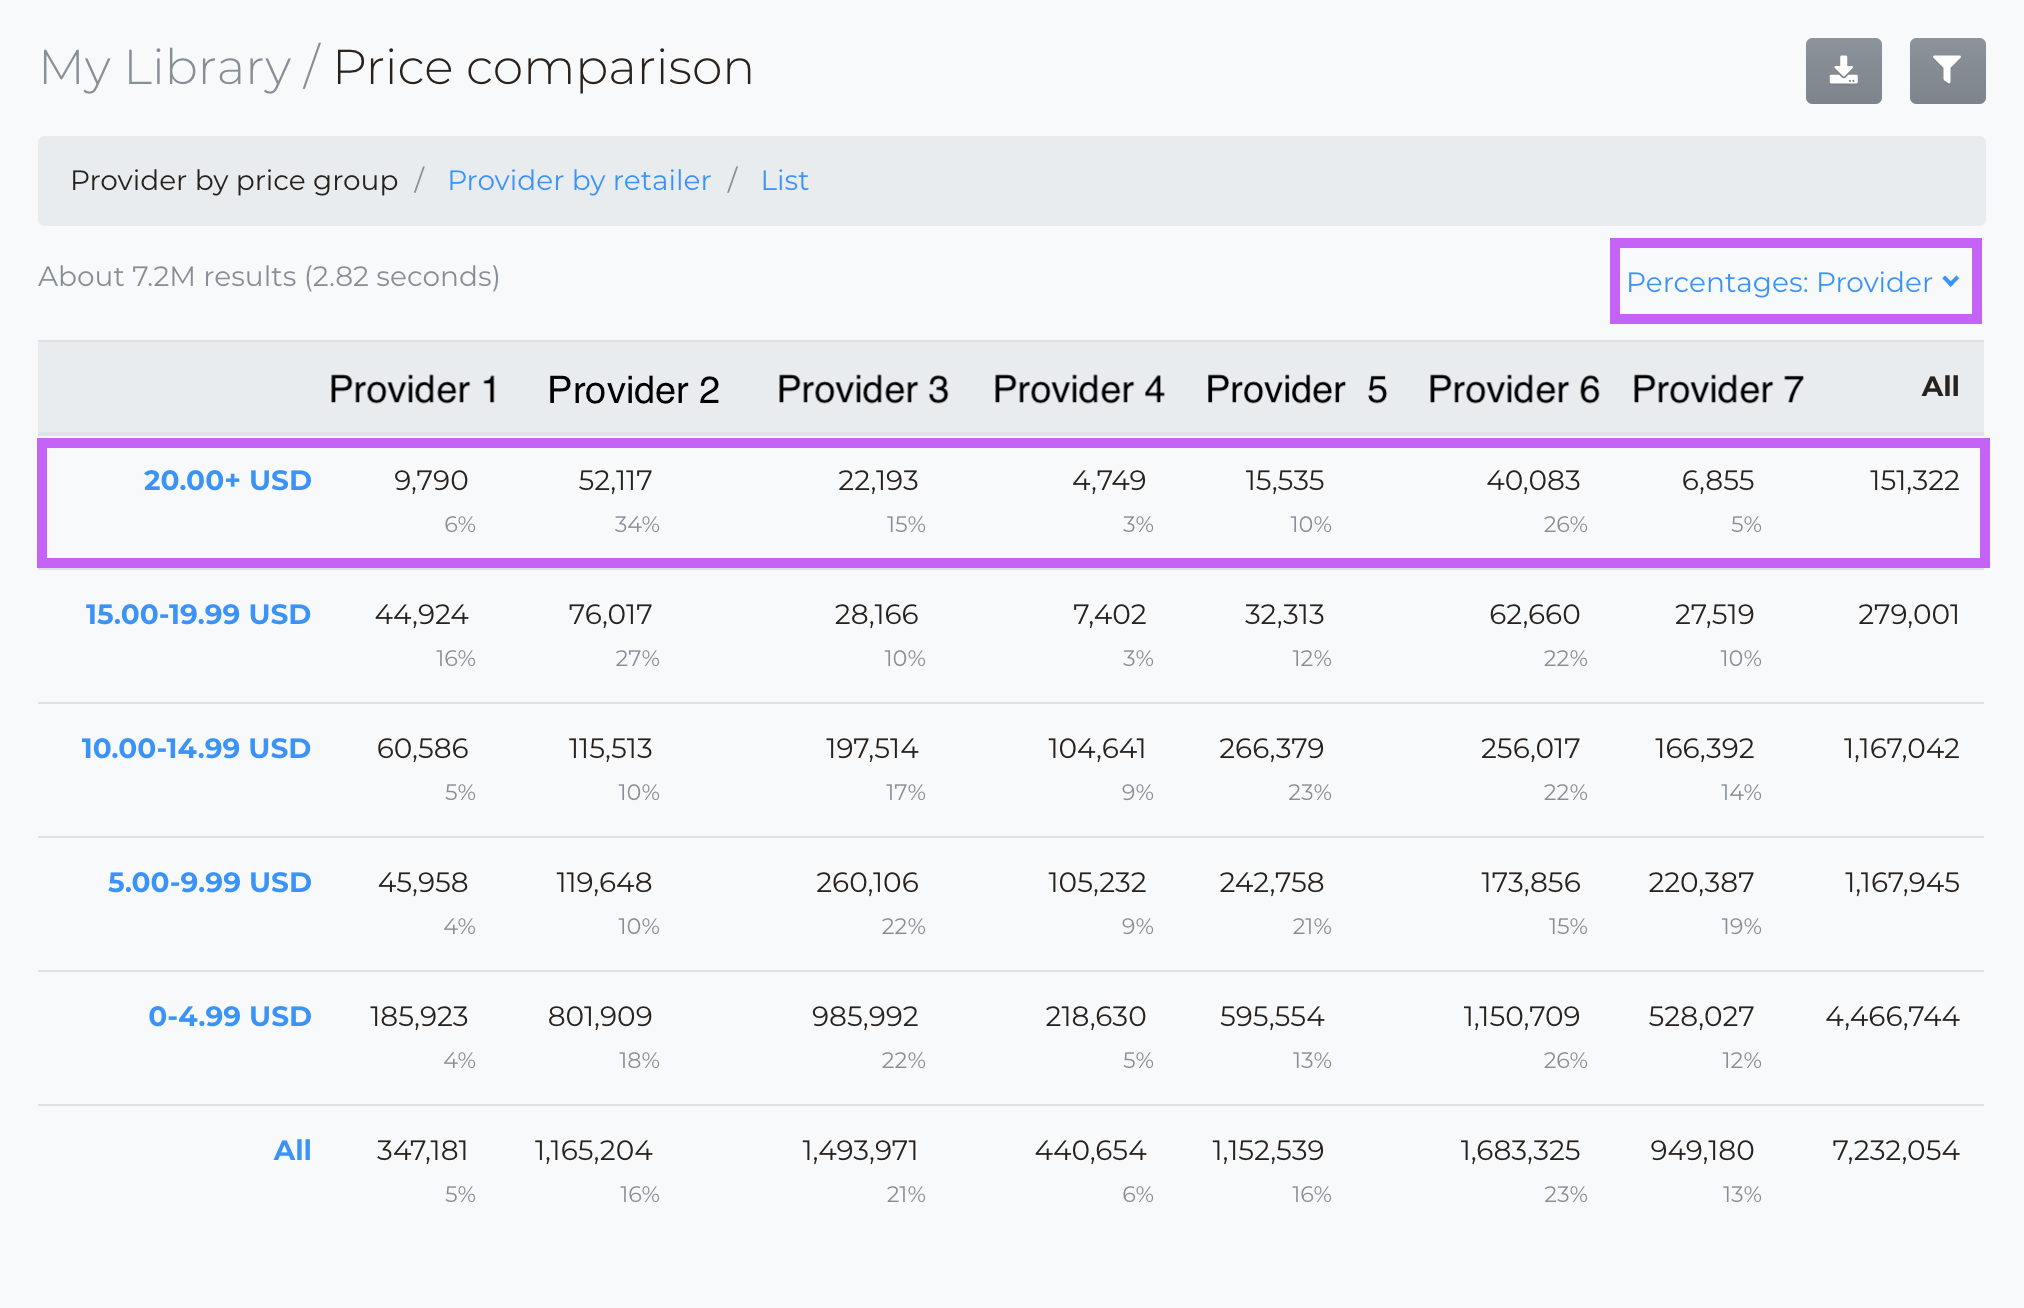
Selecting 'Percentages: Price Group', will show the percentage of a provider's library in each price range:
In this screenshot, Provider 4 has 1% of their library in the $20.00+ price range. 50% of their library is in the $0 - $4.99 price range.
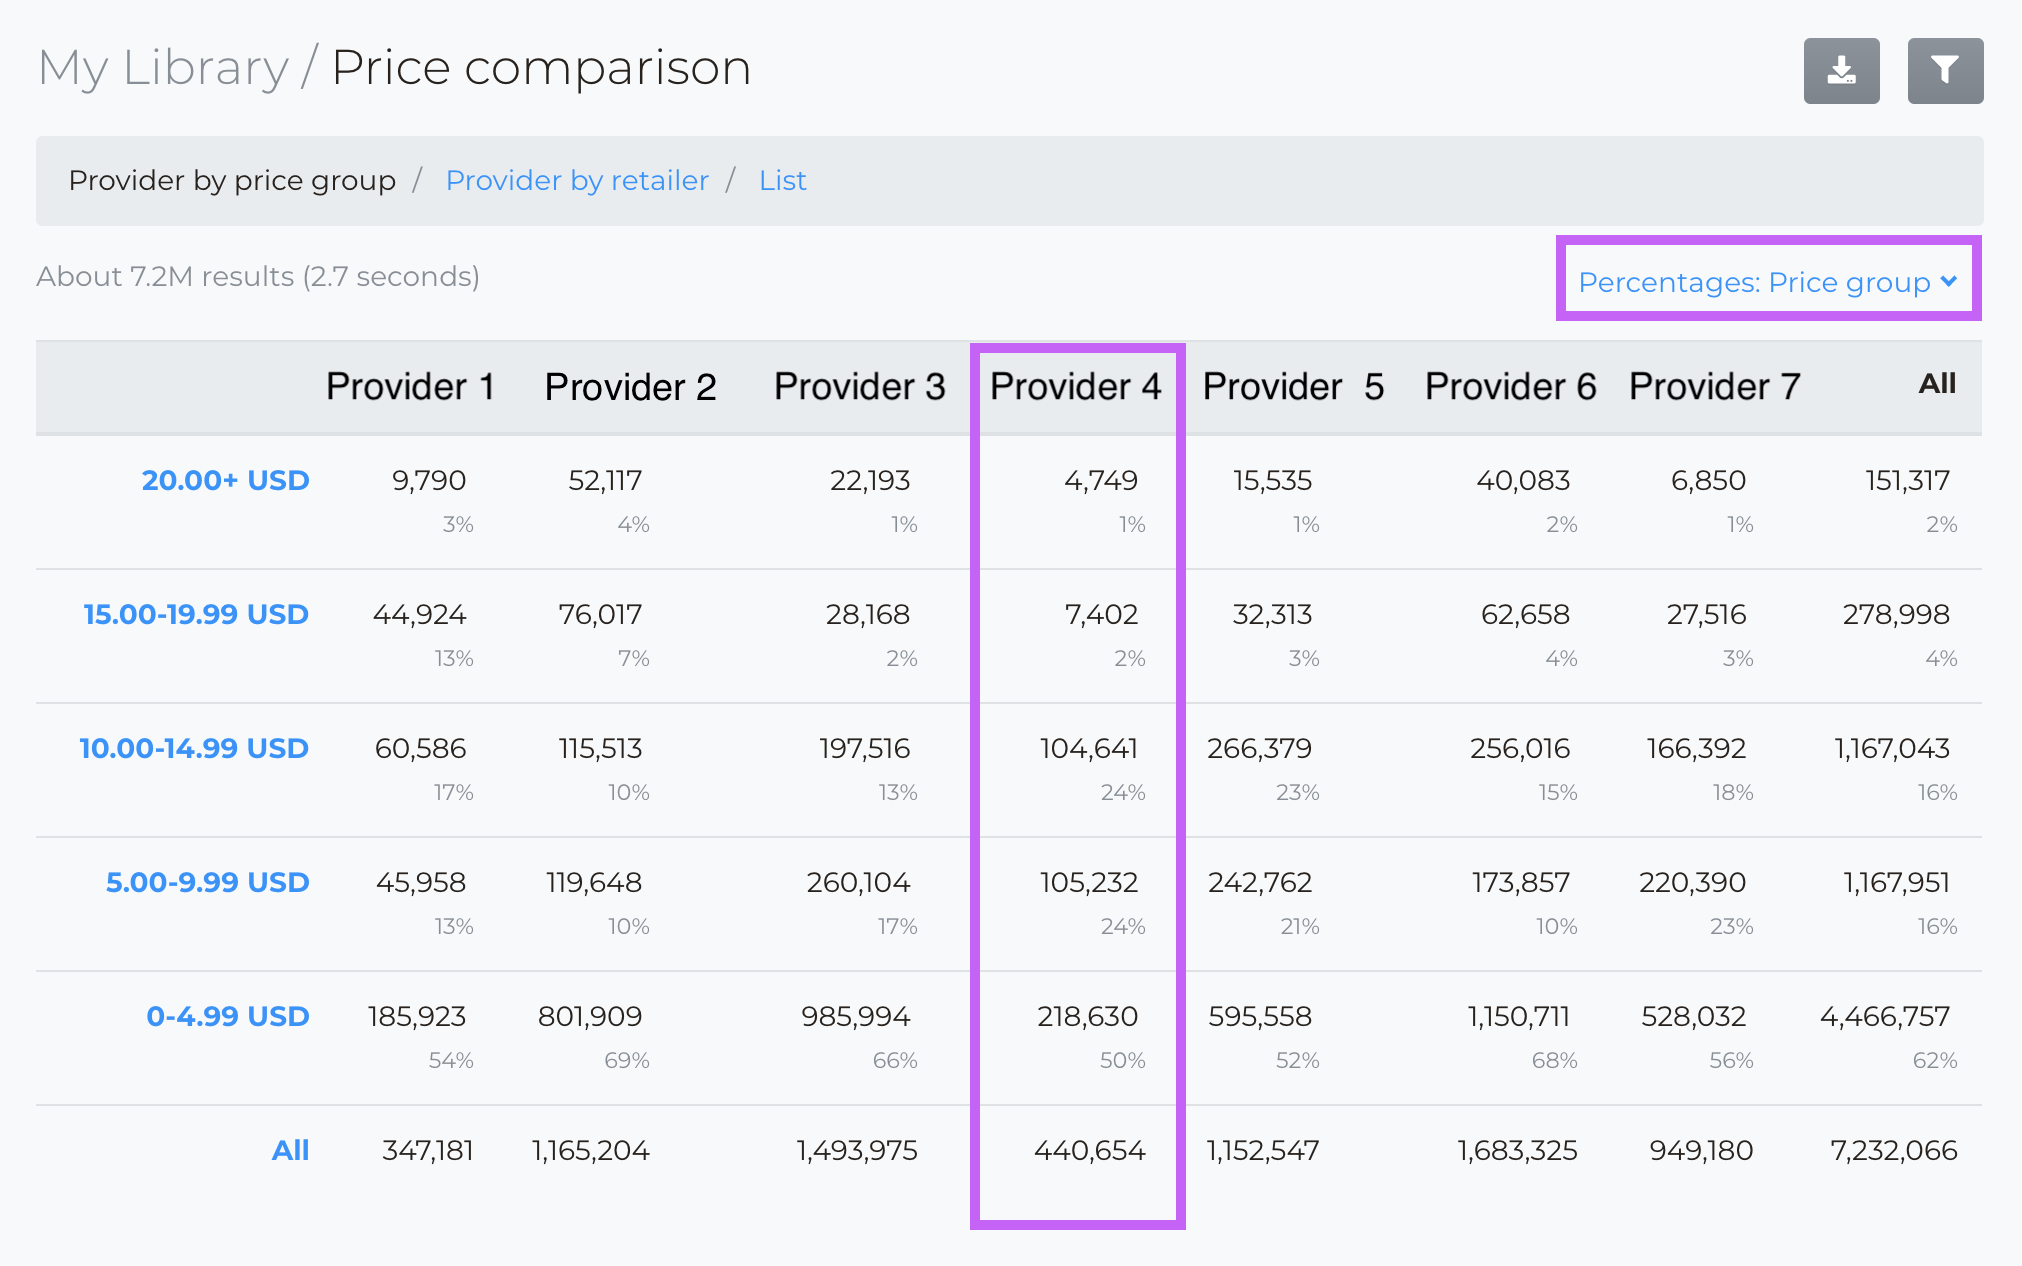
To see a list of title availabilities in a specific price range, click on a price range on the left of the table:
Once the page refreshes, title availabilities are grouped by retailer and provider.
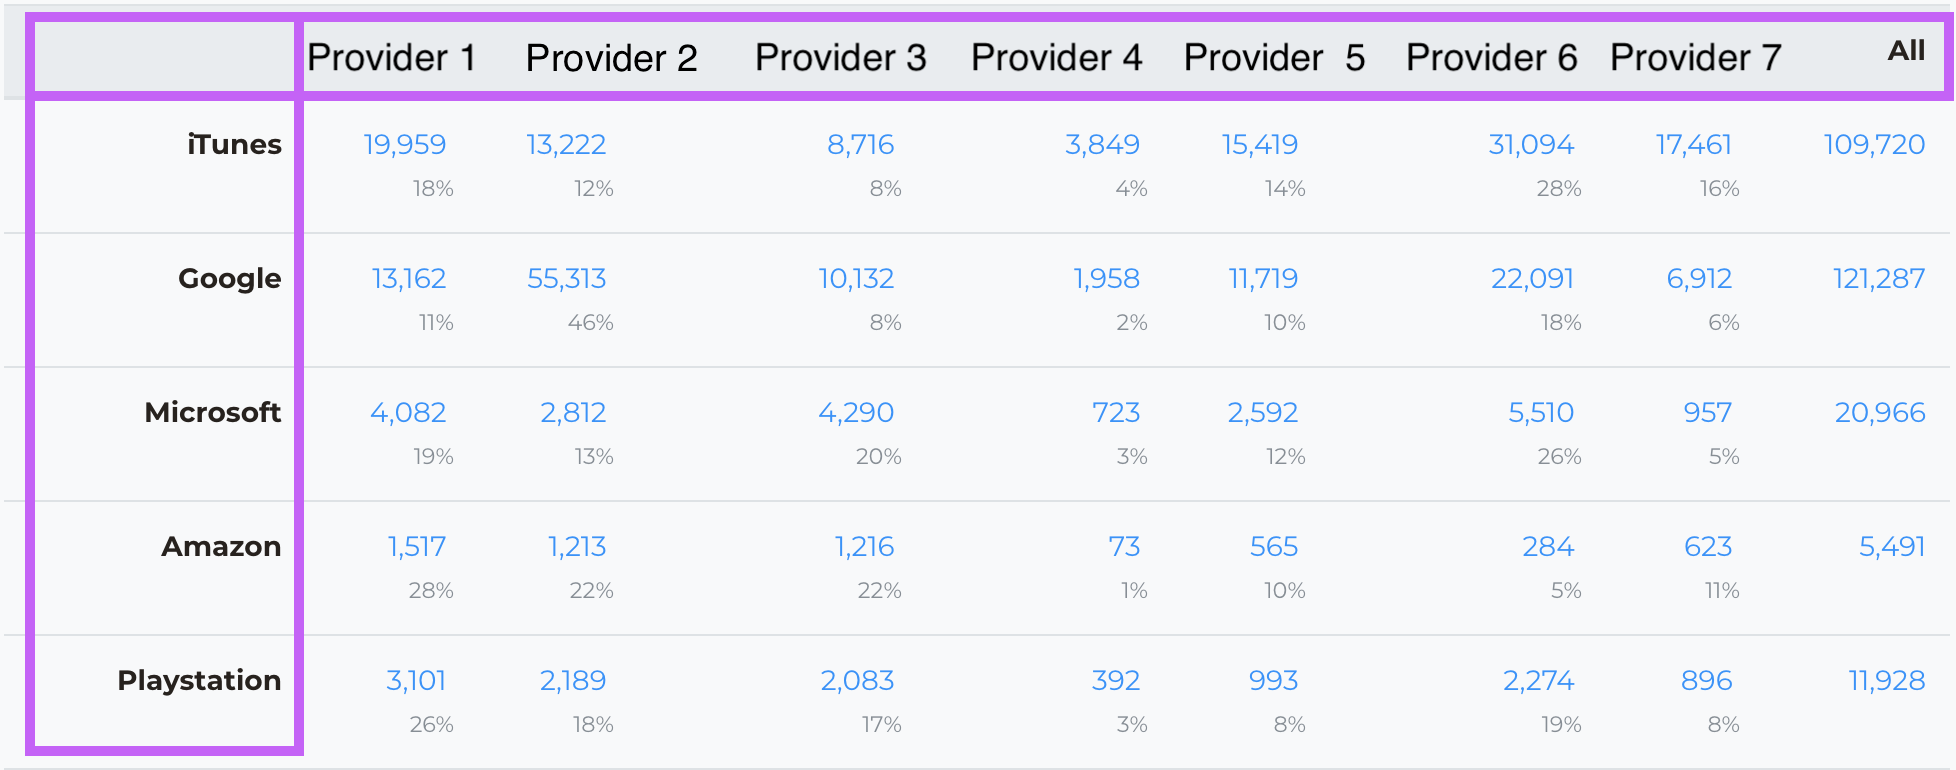
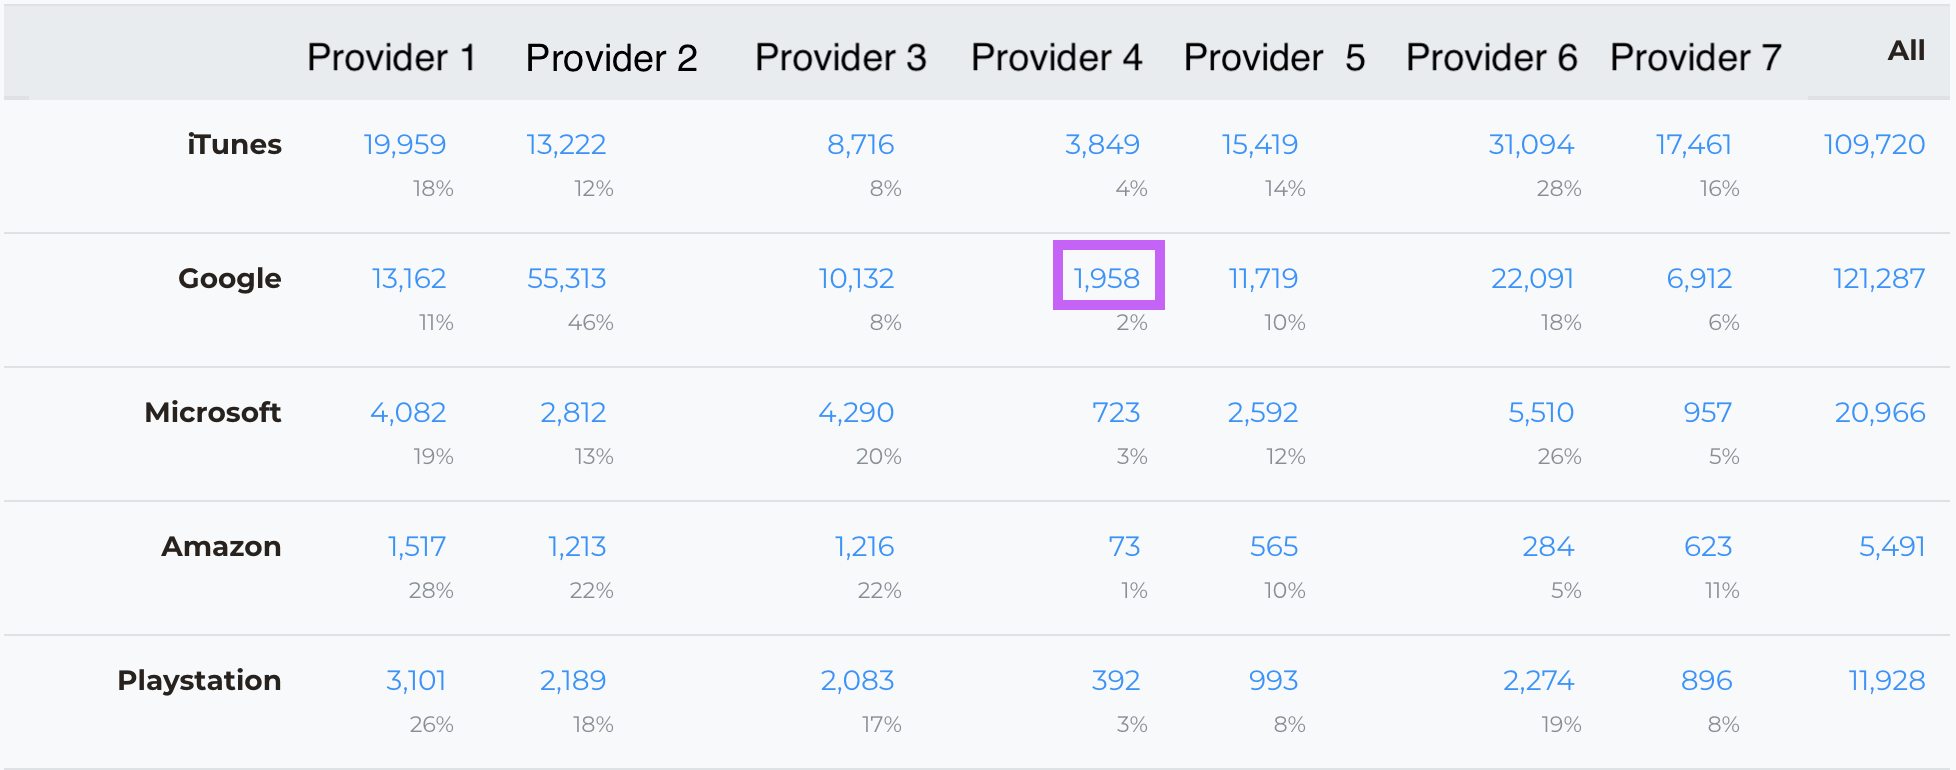
To see a list of title availabilities for a specific retailer or provider, click the intersection of values.
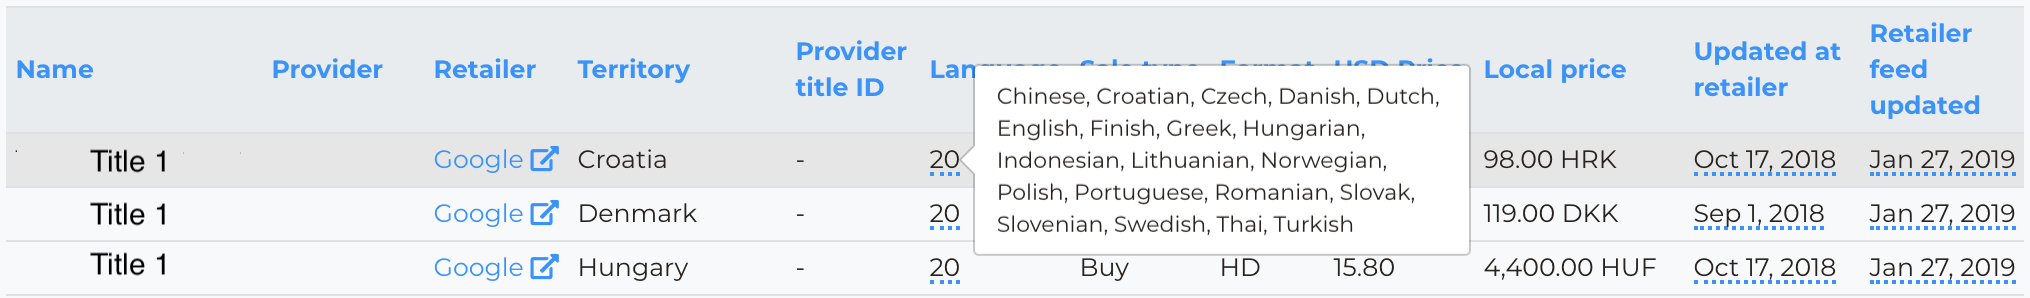
Once the page refreshes, the page will display a table with title availabilities.
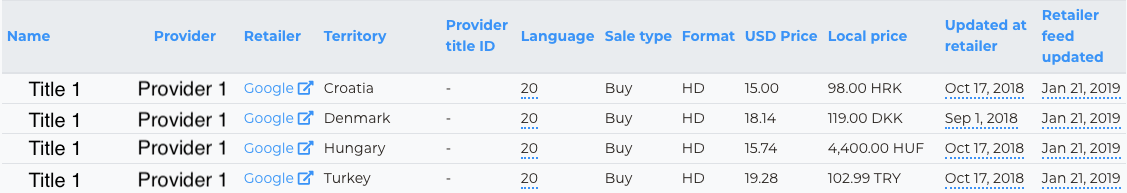
For details on the columns in this module, please click here
Any value with a dotted blue line will show more information upon hovering over with your mouse: