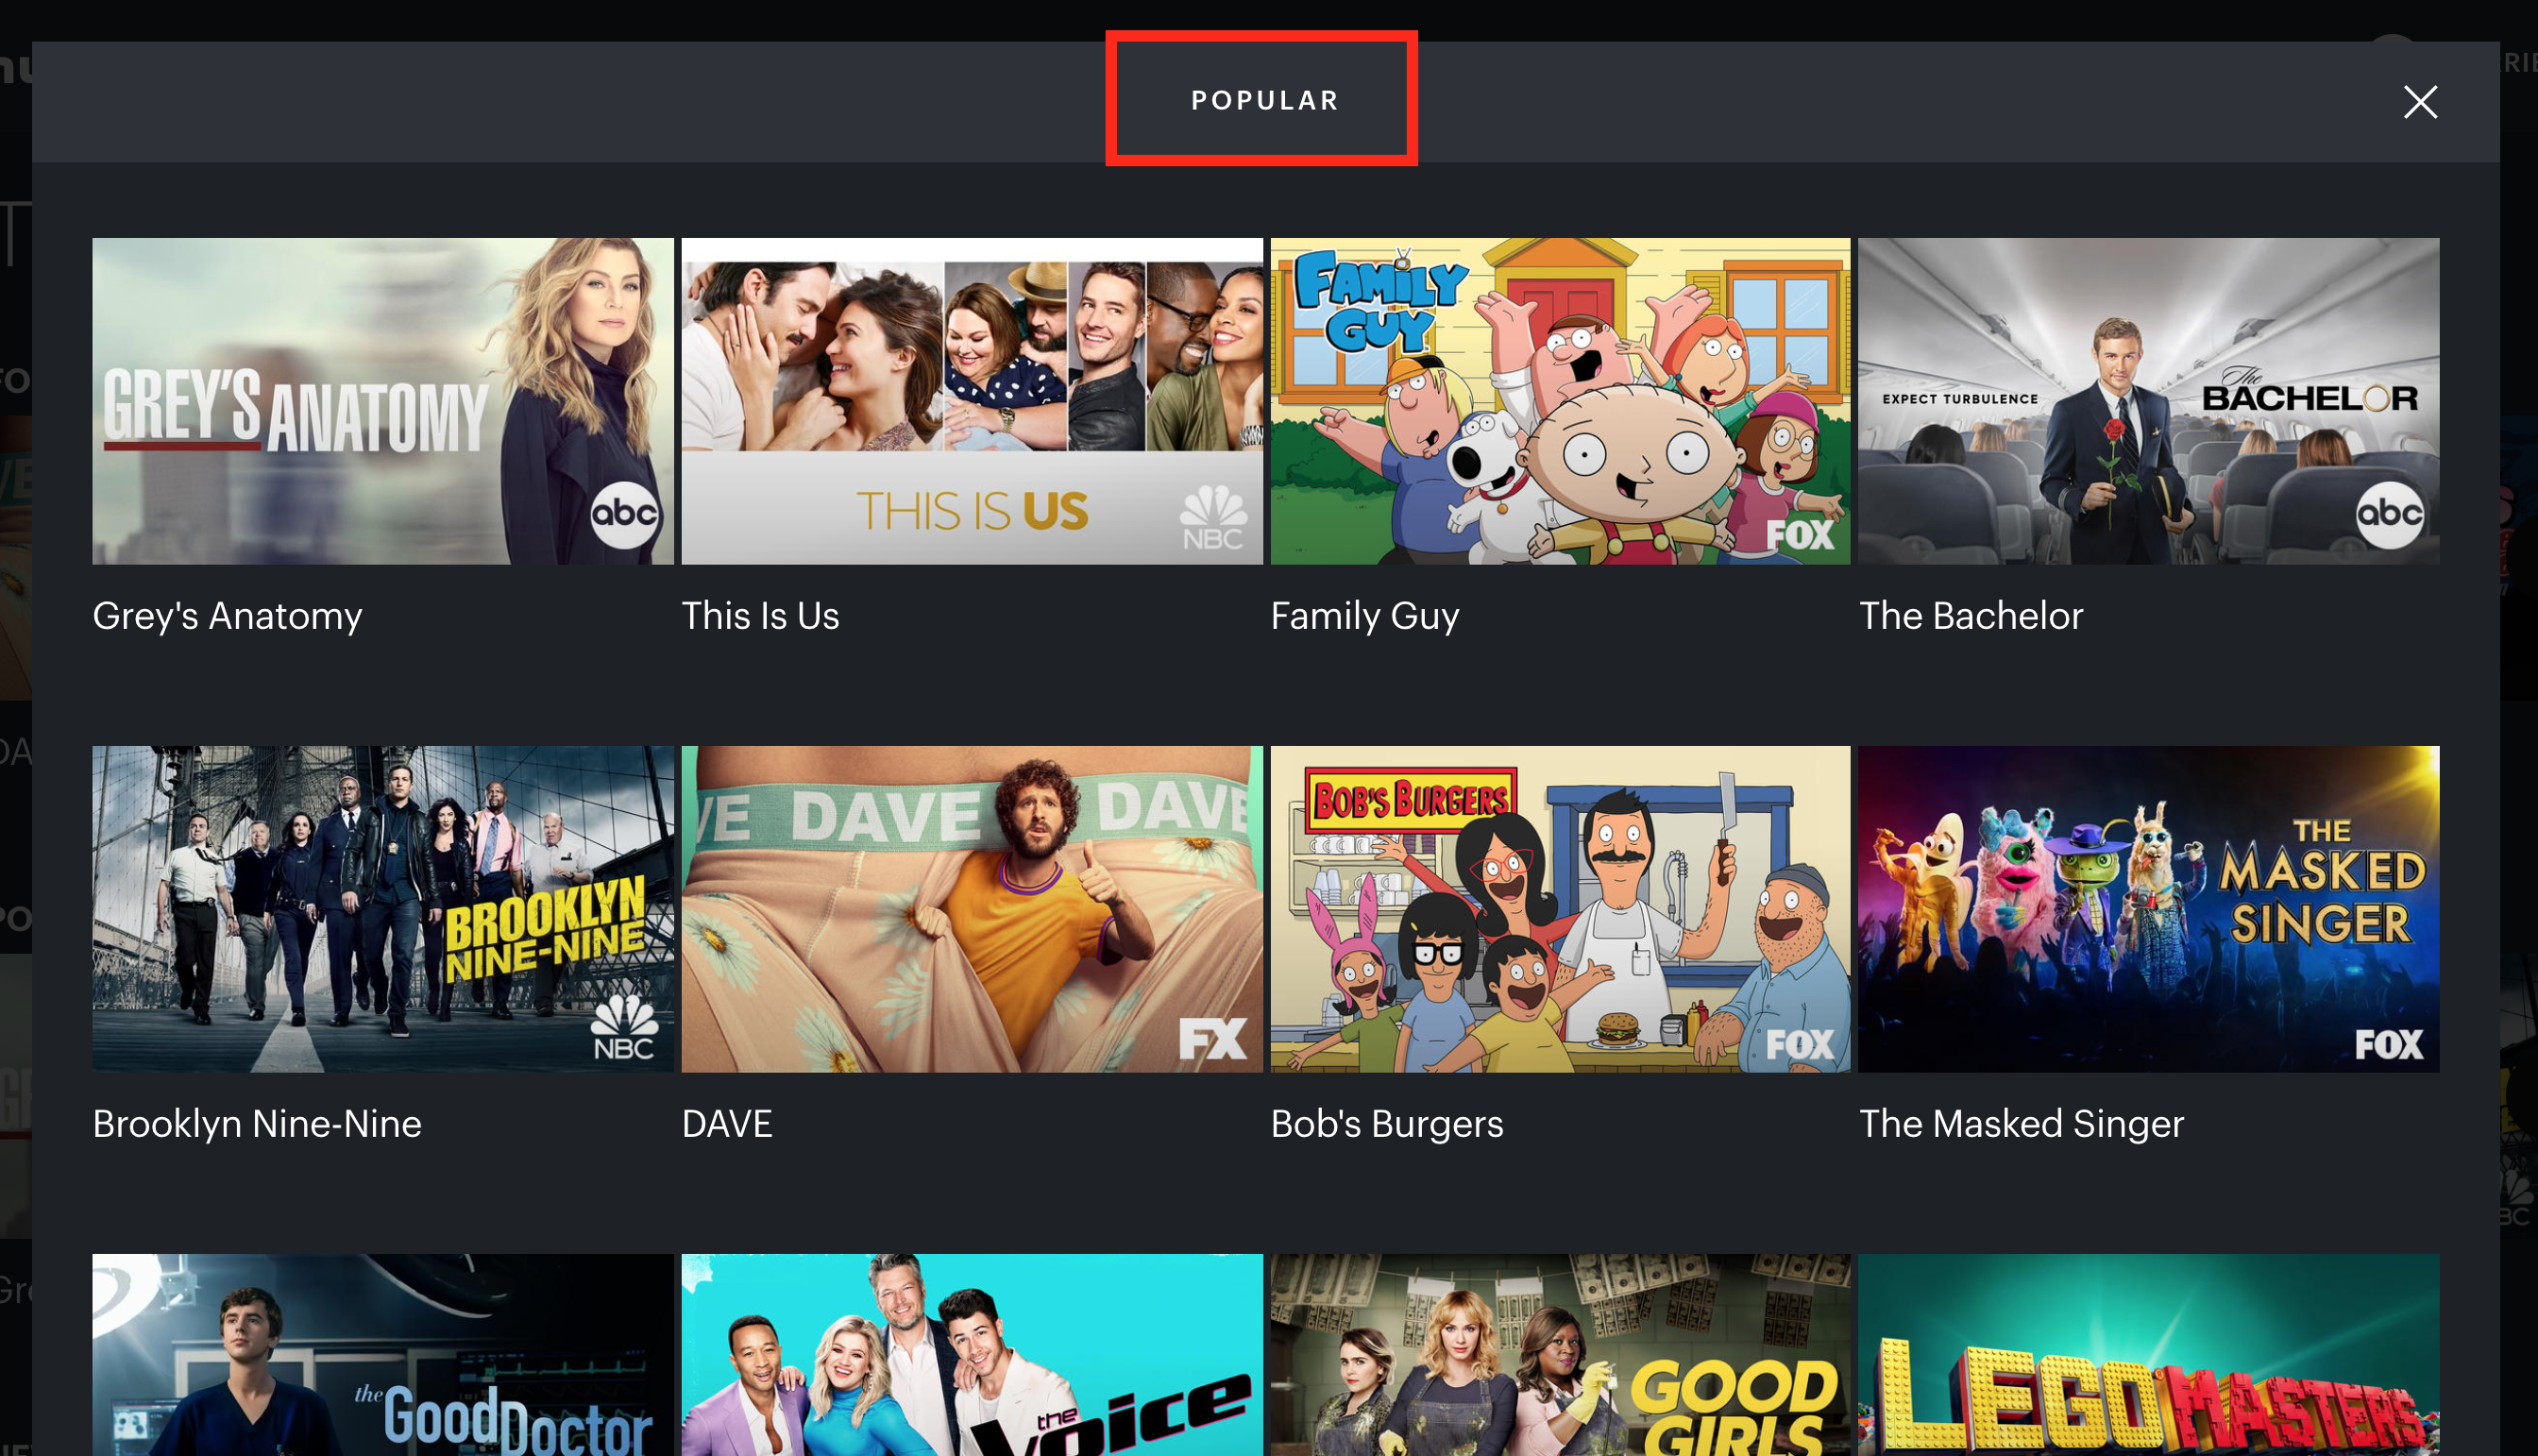
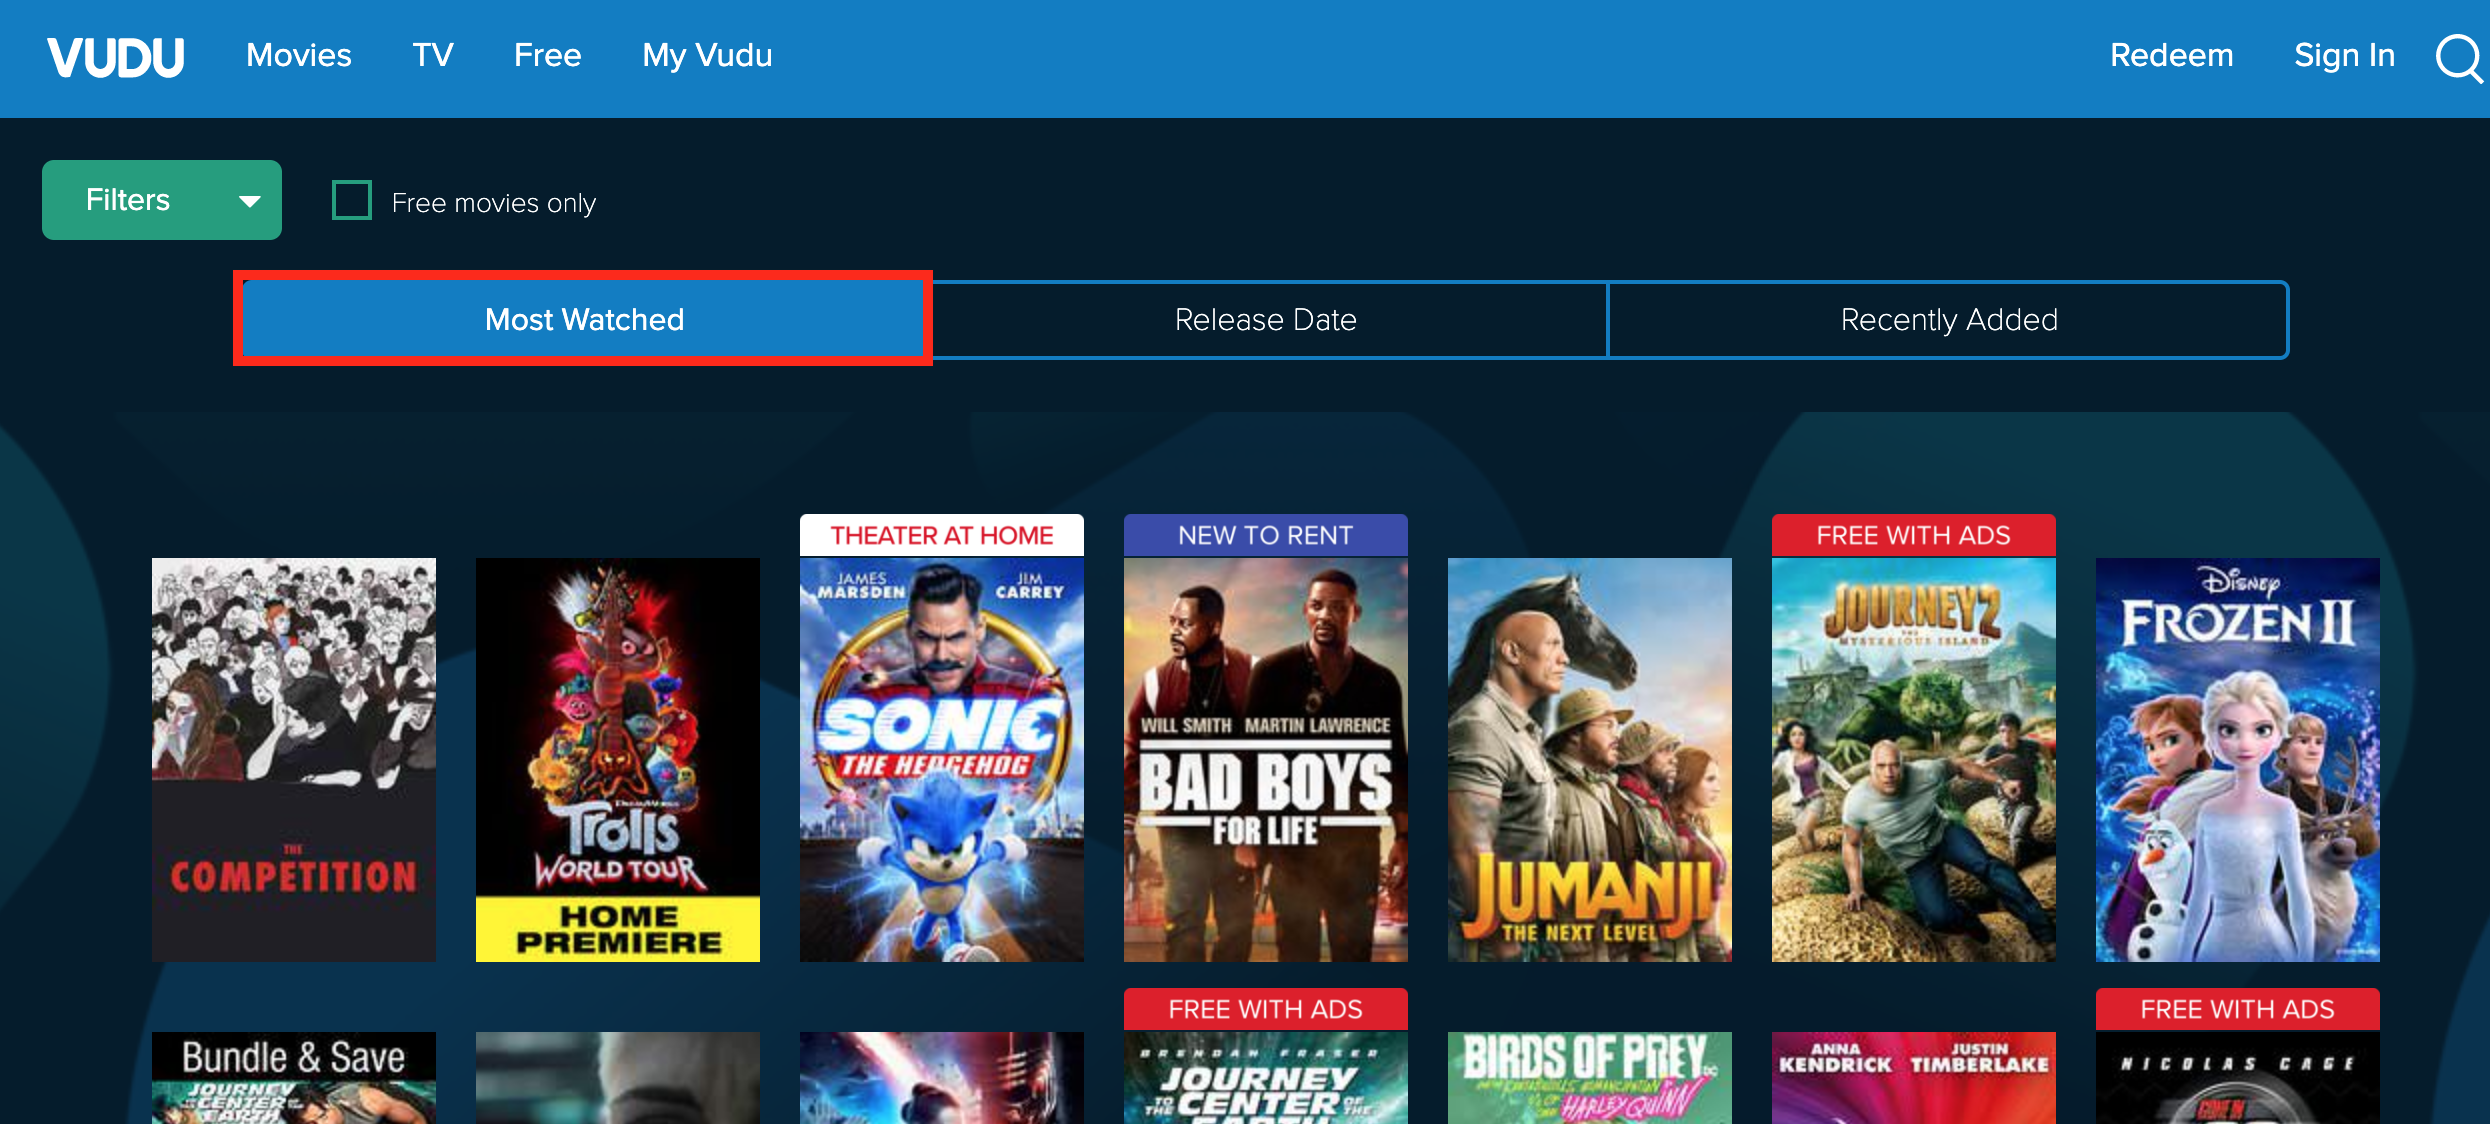
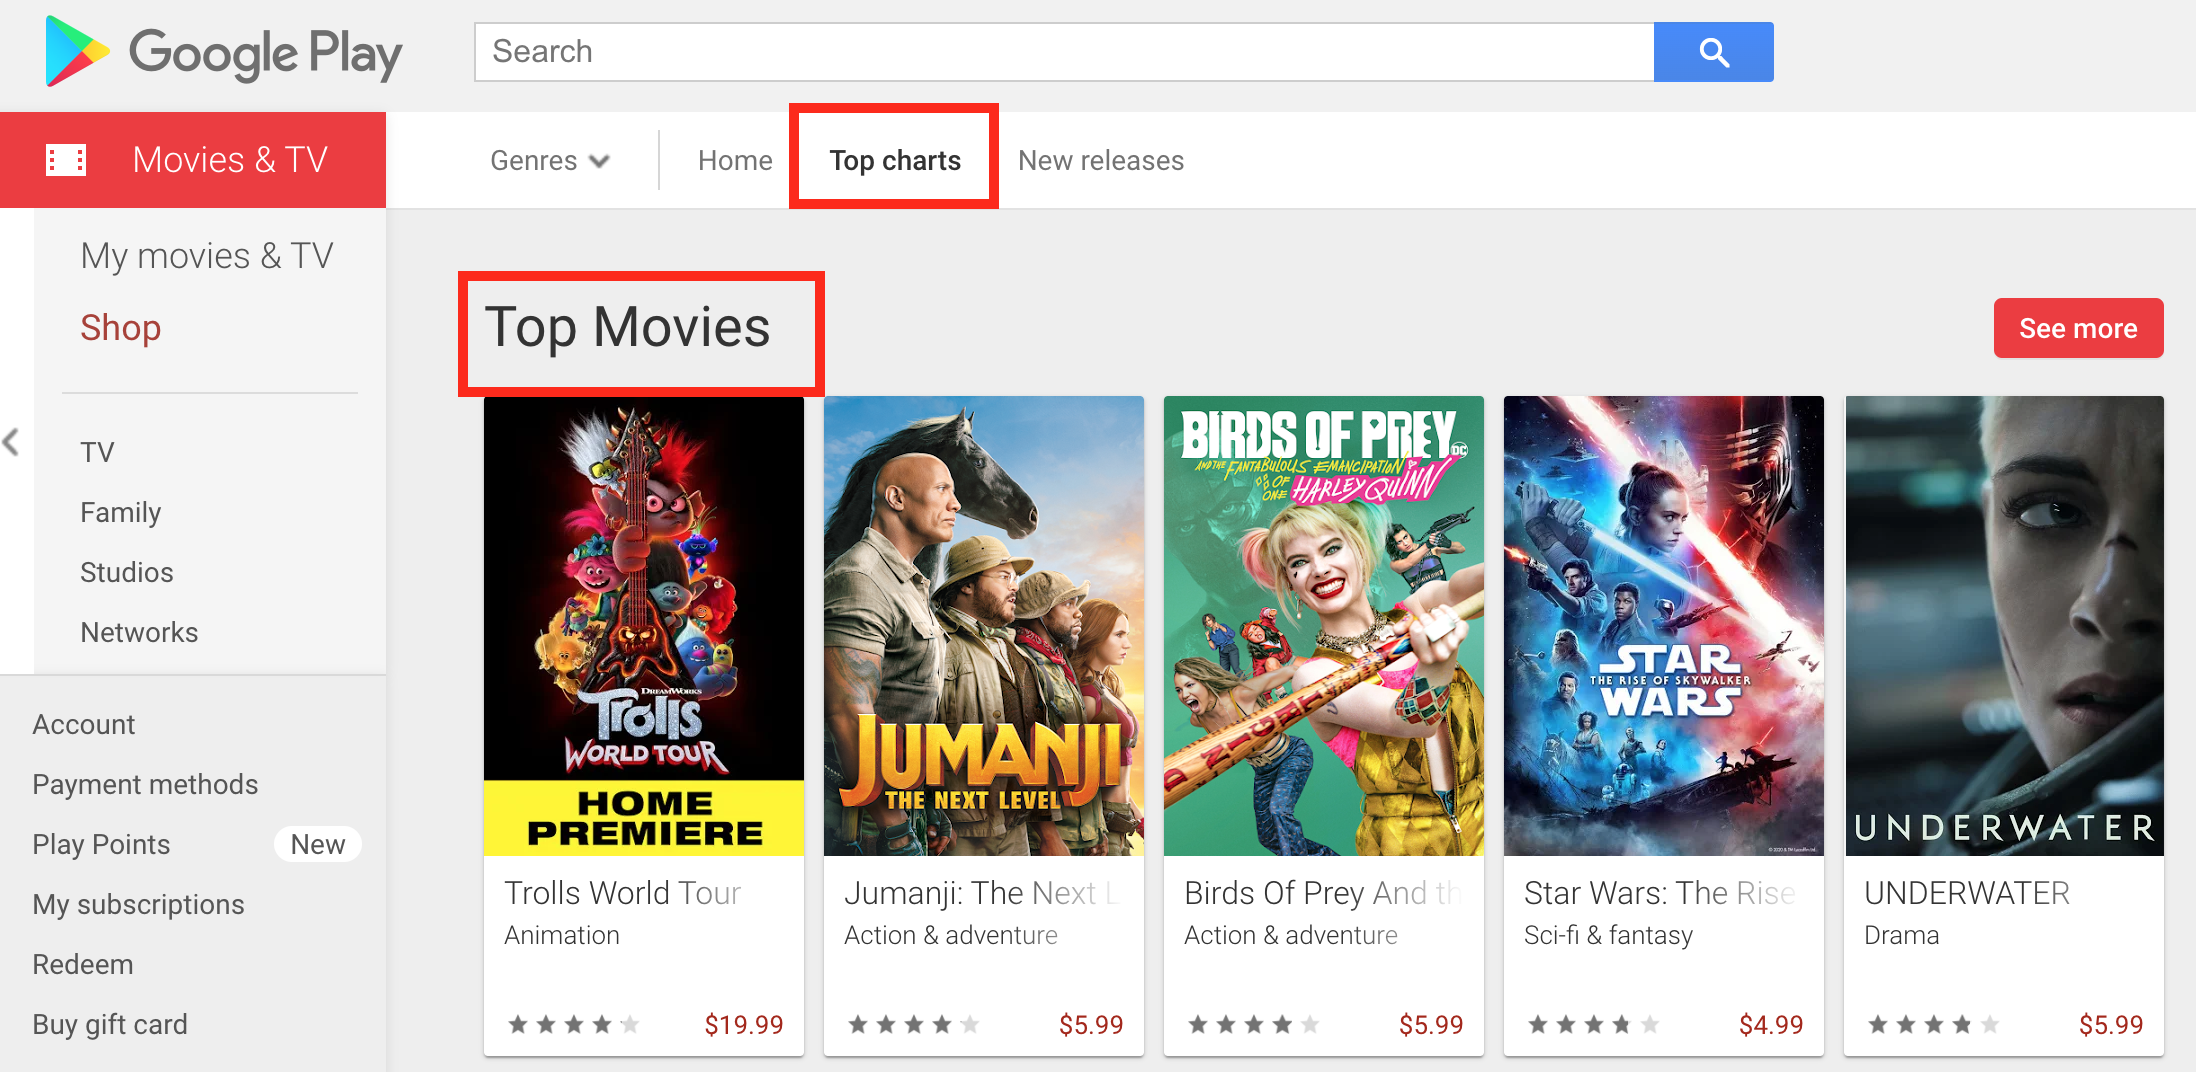
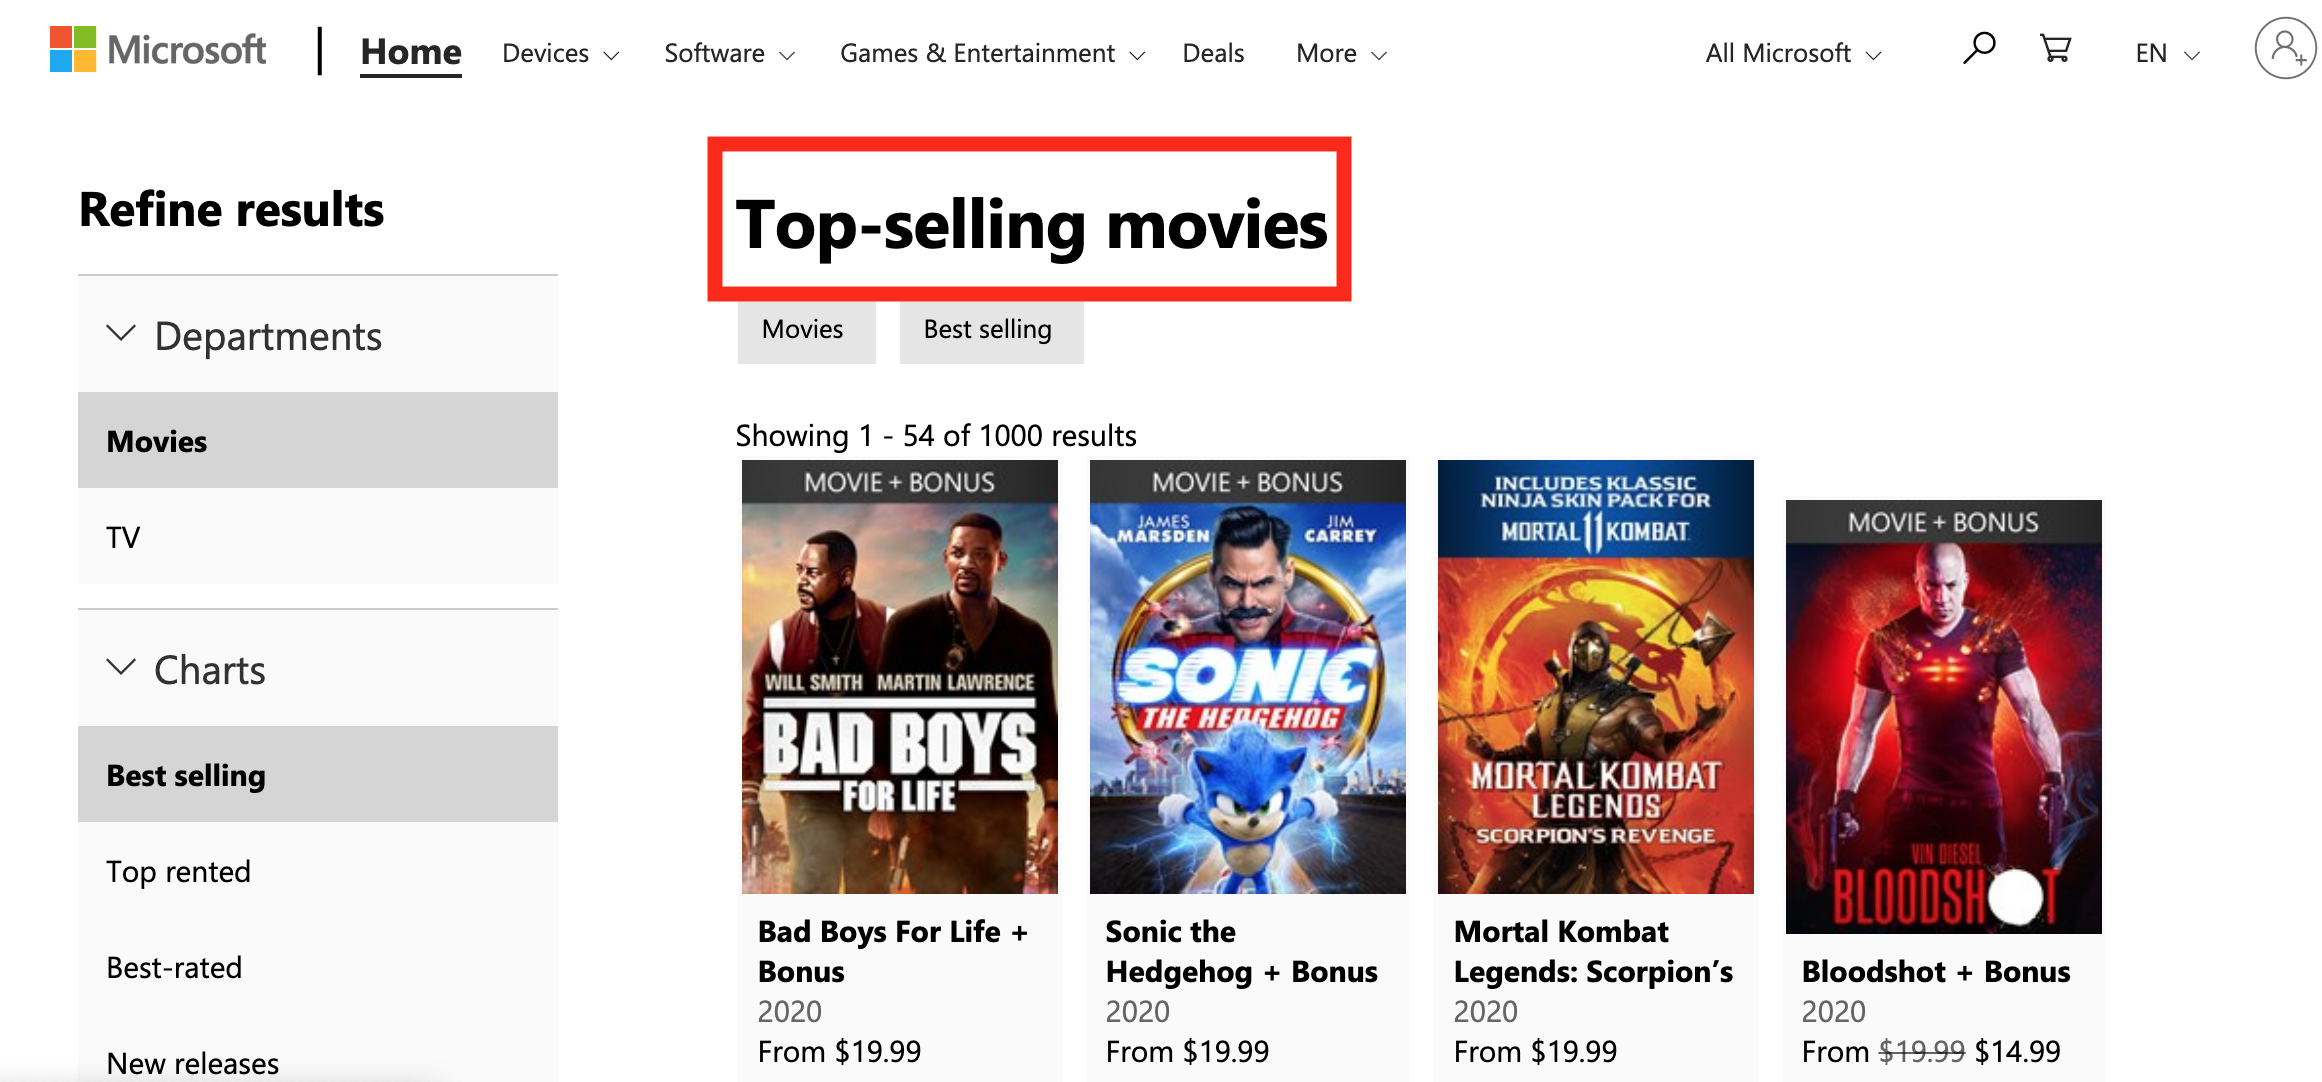
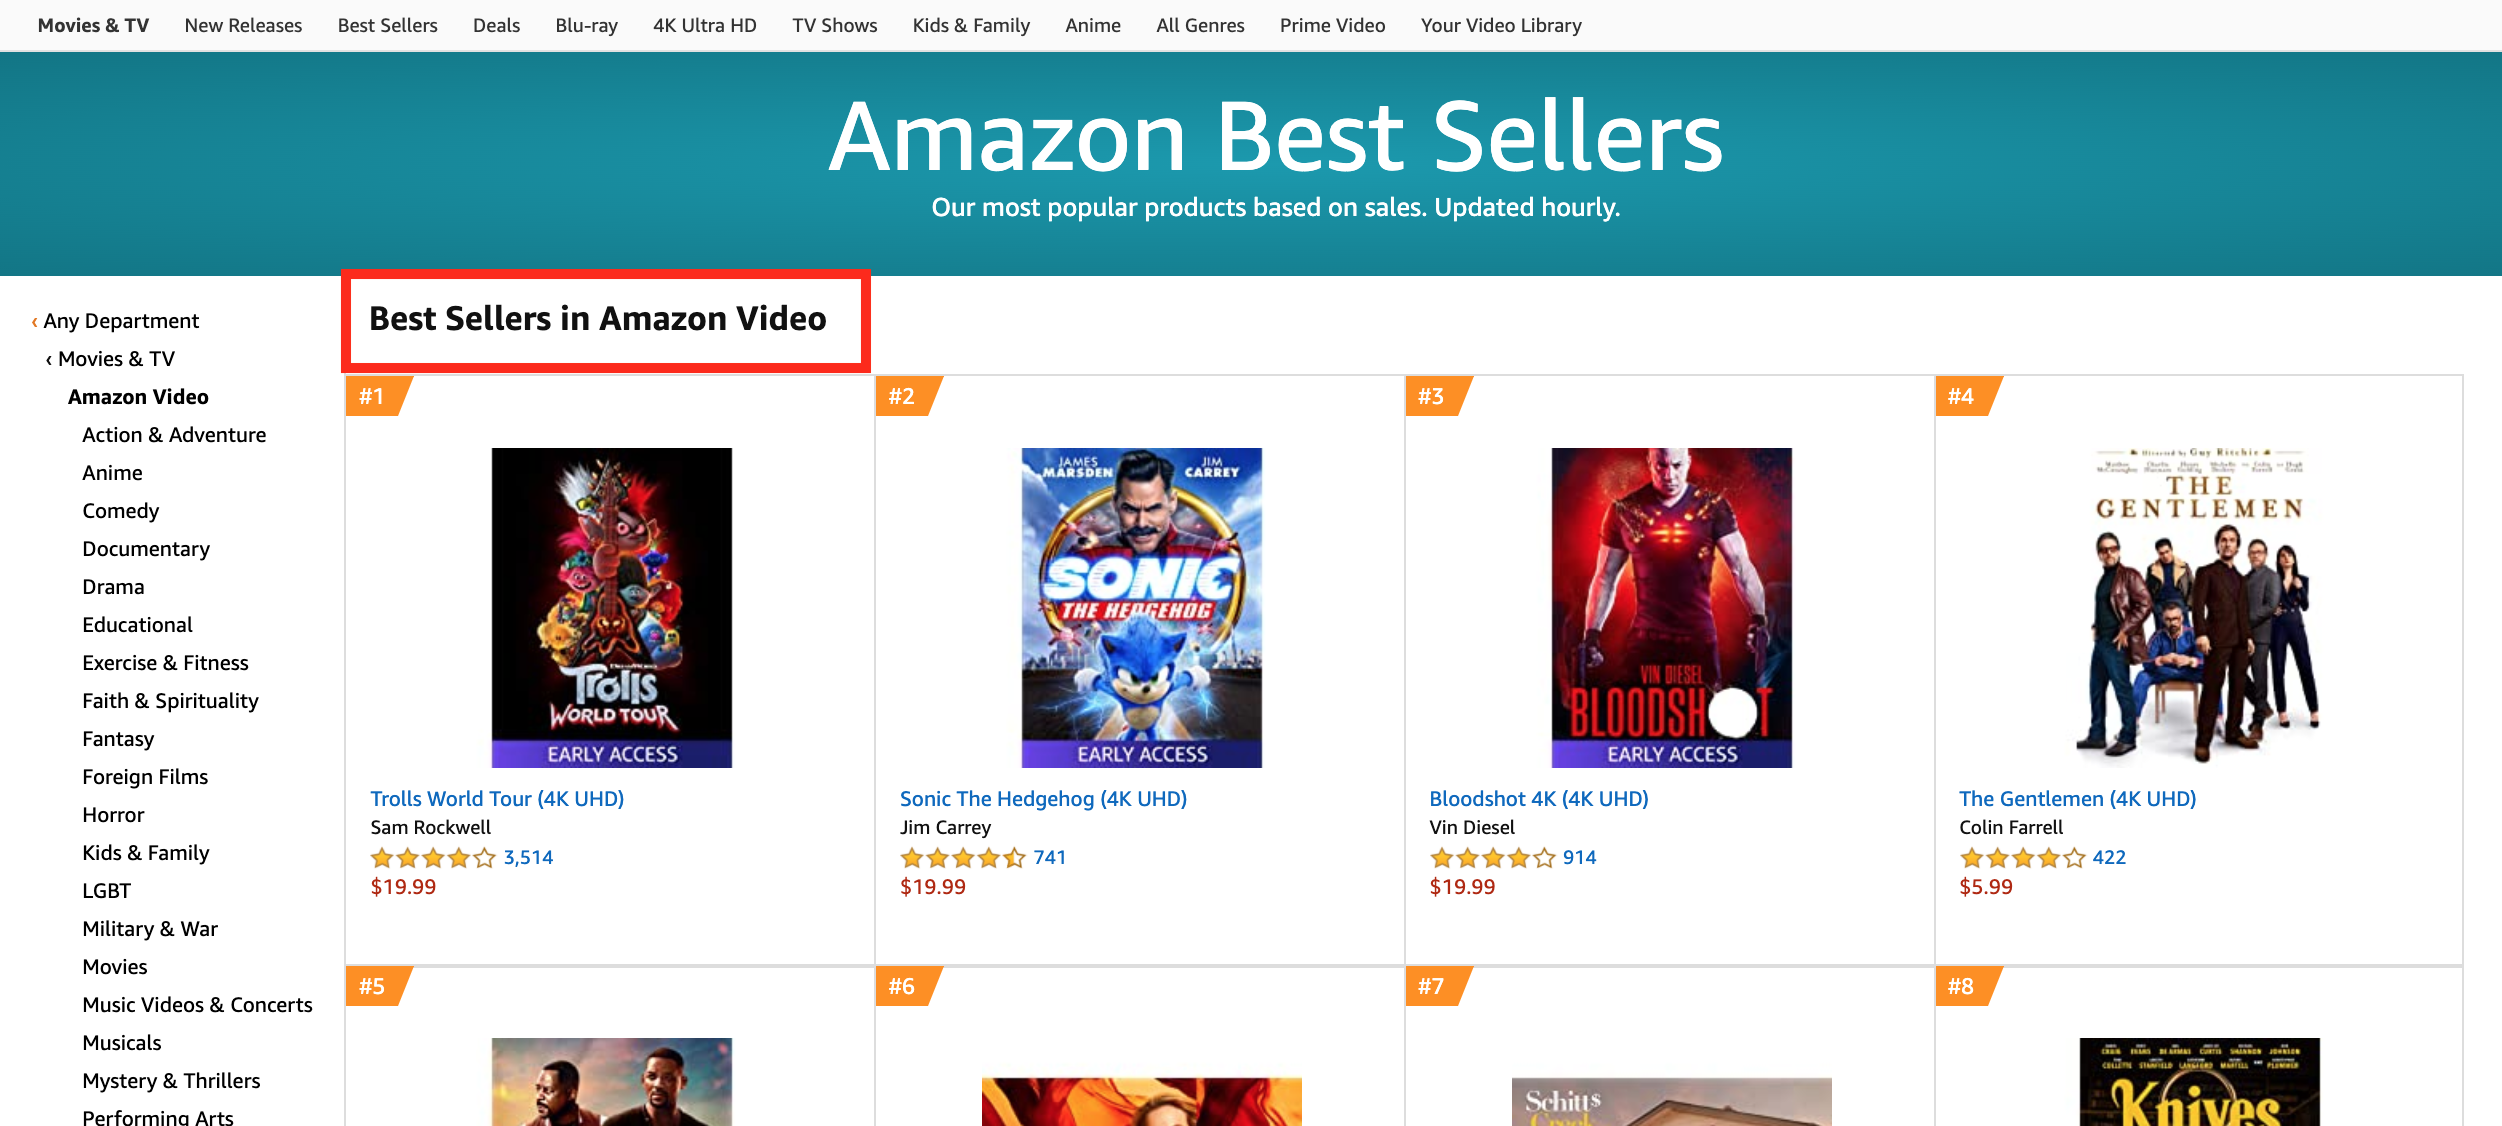
Charting data is pulled from "Top" Television and Movie pages from online storefronts.
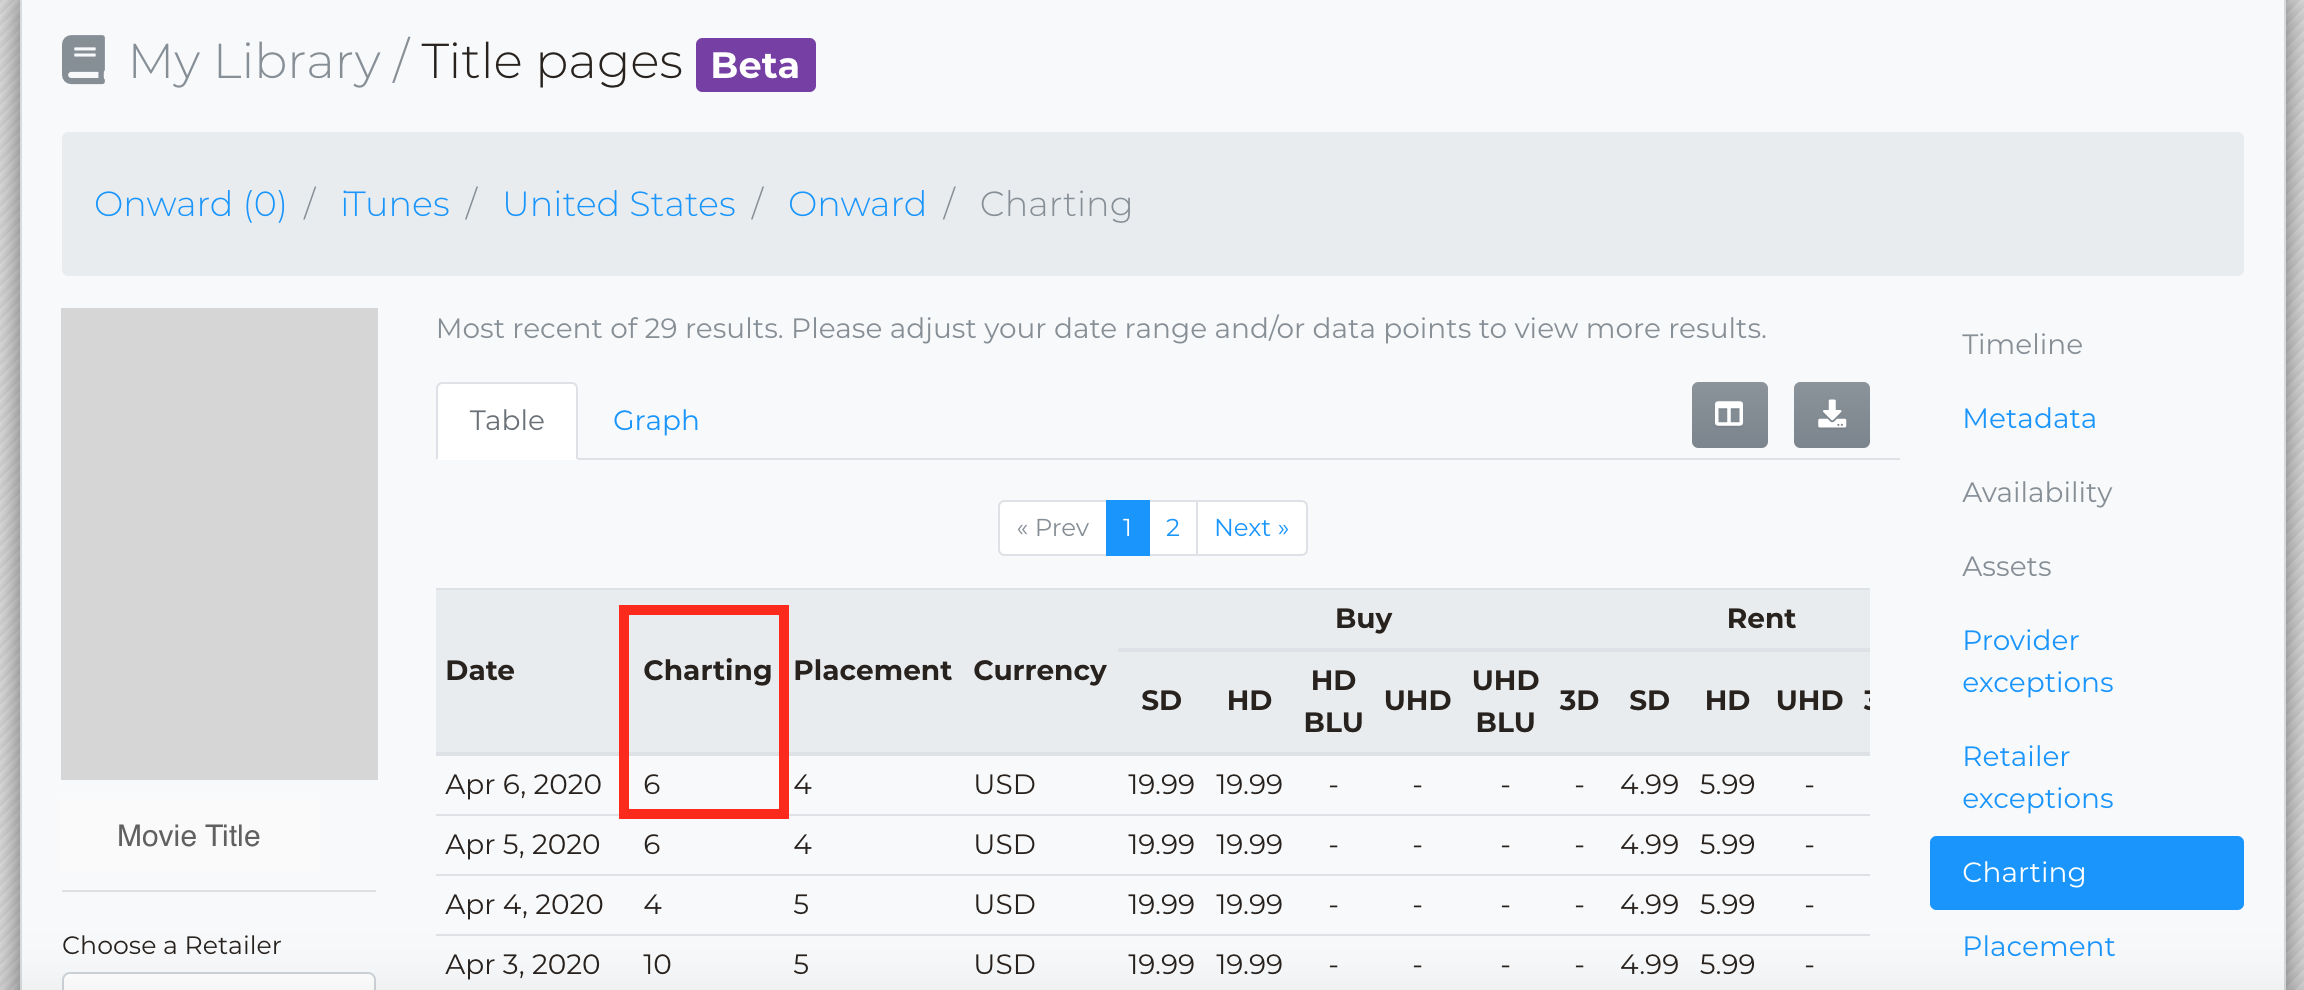
Once users have selected a title, they will be taken to a "Title Page" where there will be two ways to view that title's current and historical charting data:
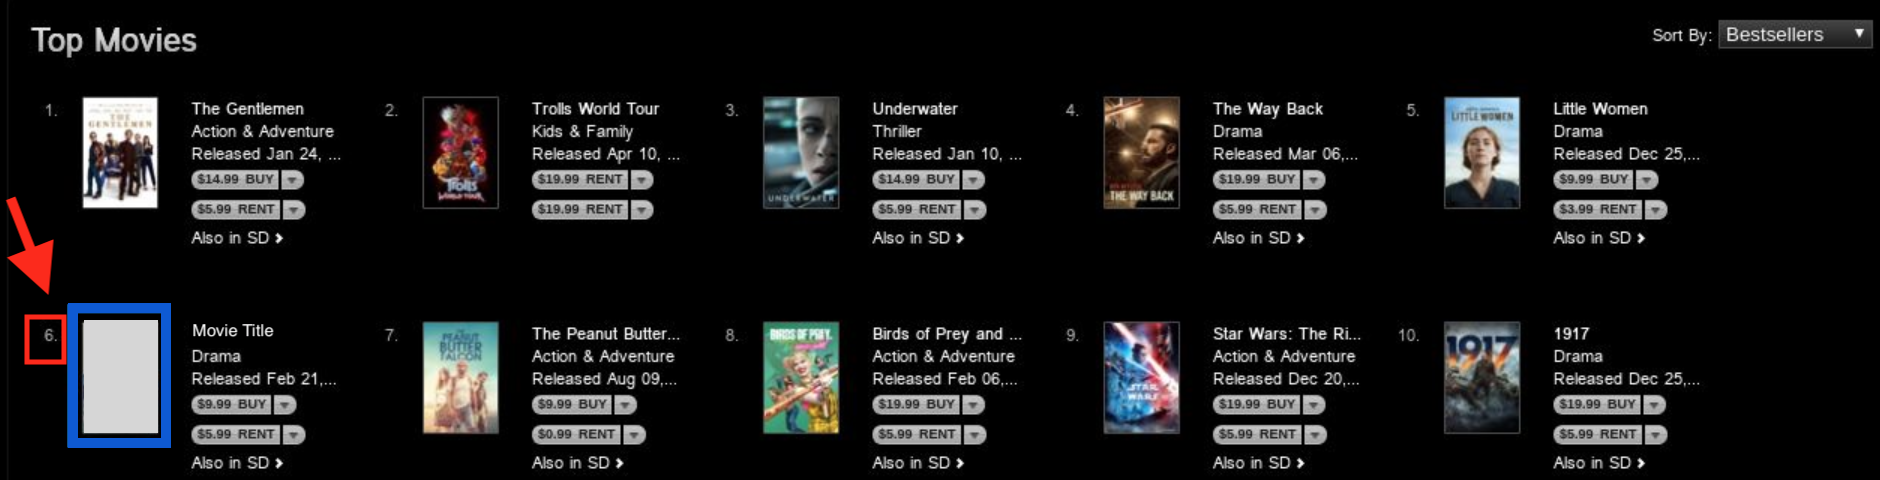
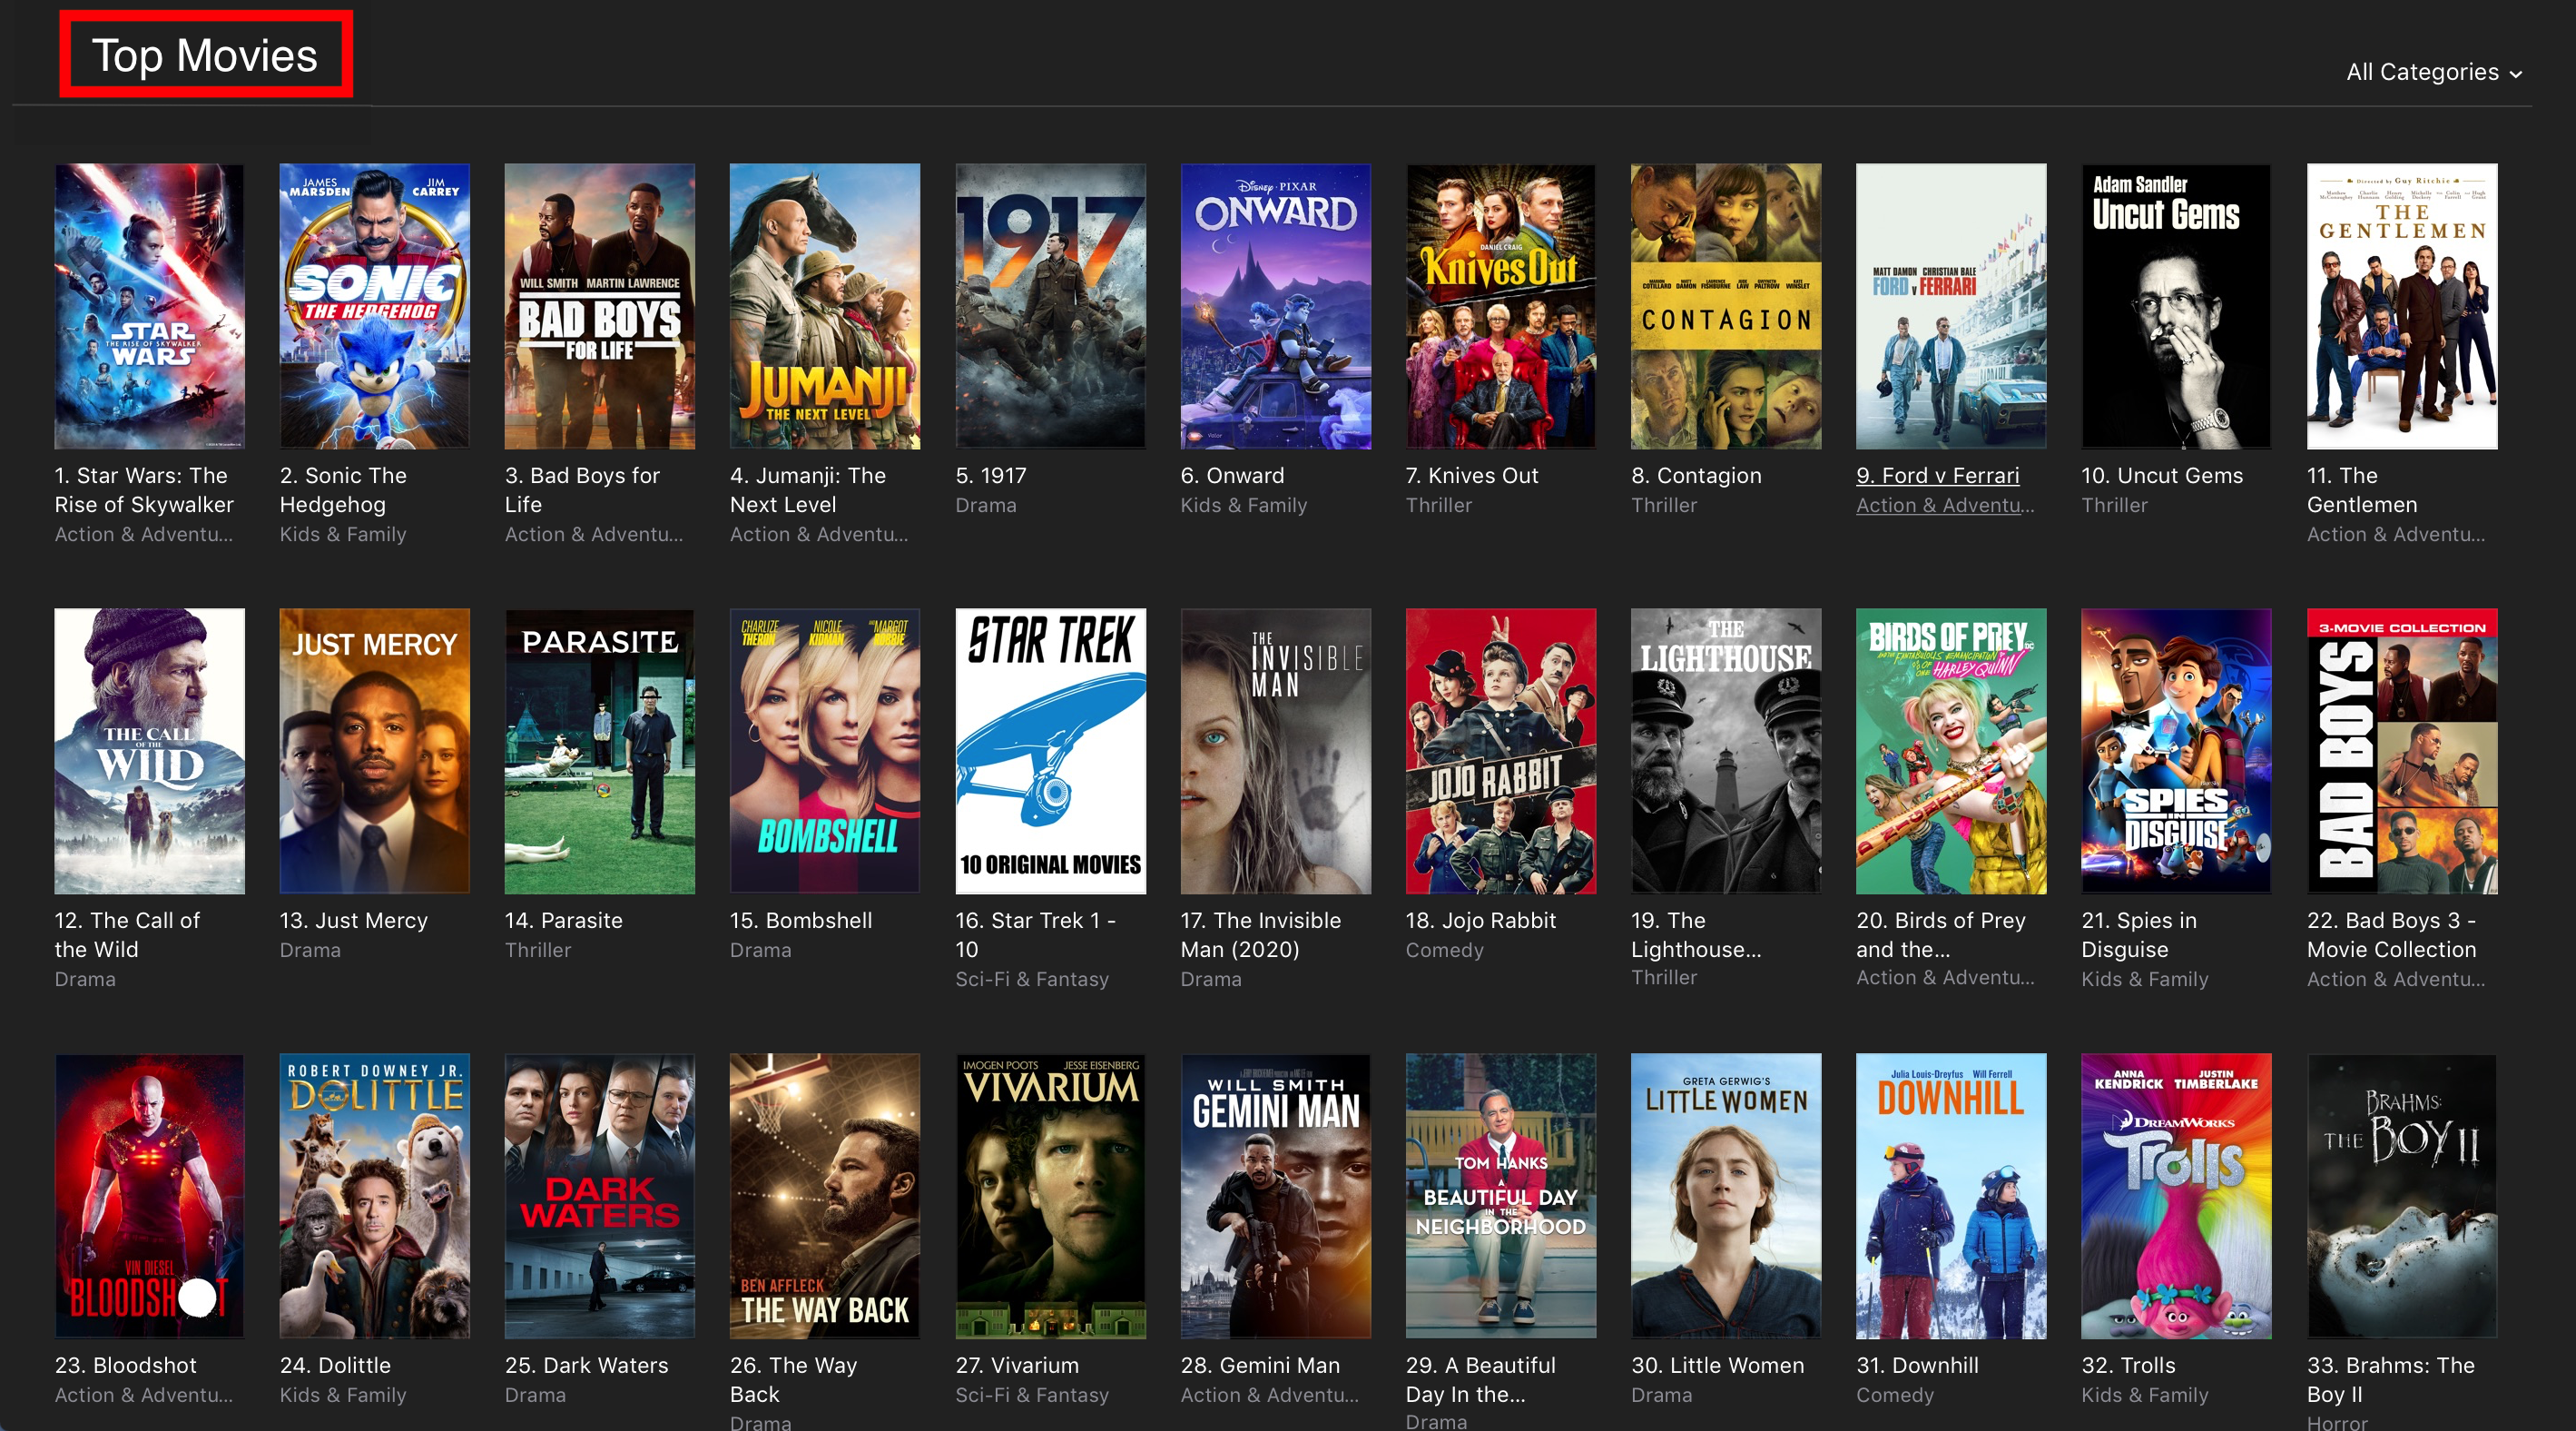
1. The first view is a table where all details for that title will be available. The charting column displays a number that represents the numerical placement of that title on a retailer's "Top" page.
For example, shown below this movie is placed as the sixth movie on the "Top" page for that retailer.
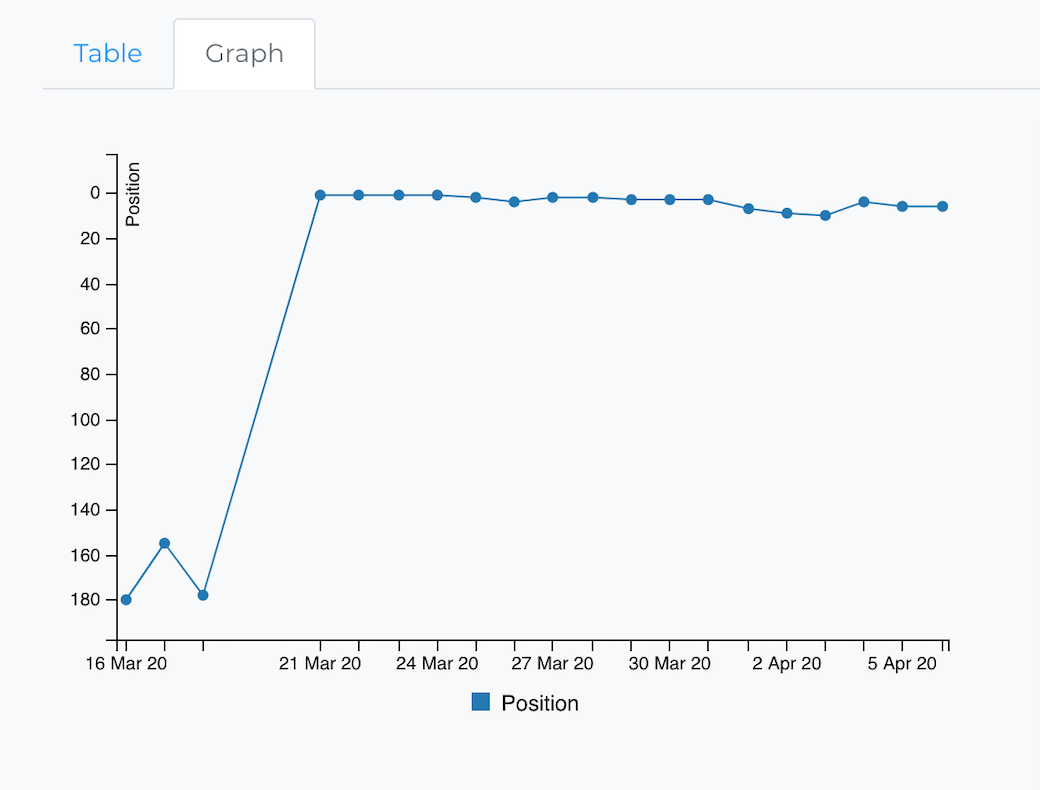
2. The second is a graph view that will visually show that title's charting position over time.
NOTE: STOREFRONT also offers the ability to add royalty data for a more in-depth view of charting performance. For more information on including royalty data, users should reach out to a designated sales representative.
Charting pages per Retailer
Below is a list of retailers that offer charting data and the pages this data is pulled from per retailer.
Additionally, clicking on each retailer name below will lead to an article with more information on that retailer.
Hulu